
I, the author of this blog post, am Mart Rae and I am an engineer in my own company Rae Geodesies OÜ. For more than twenty years I have been involved in construction and if not always surveying on the site, I have always been a geodesist at heart. For the first 14 years I worked for the Nordecon group, starting as assistant geodesist and ending as chief geodesist. In the meantime, there was a brief stint as managing director of a geodesy company, but for the last five years I have been working as a geodesist in my own company. Words like surveying, design, 3d modelling, machine control, BIM, etc. are part of my daily work, and in the process I have come to the point where working with drones is an integral part of my working life and sometimes even my leisure time.
At Rae Geodesy, as the name implies, we carry out a variety of geodetic works – from construction drawings, measurements, volume calculations to large-scale mapping. Interestingly, it has turned out that almost half of our turnover is generated by unmanned aerial vehicle work and the analysis and processing of the data collected with them.
To paraphrase Agu Sihvka, in order to be honest, I have to start at the beginning and try to make a small introduction to the world of surveying in general.
While RTK GNSS receivers, electron-tachymeters, or even tape measures are the main tools for conventional surveying, laser scanners, unmanned aerial vehicles or other remote sensing capabilities are increasingly being used. In Rae Geodesy, it has become established that most of the work done with drones uses photogrammetry to obtain the results.
If I try to explain as simply as possible the differences between these different measurements, then I will call. conventional measurement ( e. contact measurement ) means that someone has to walk to, point to or find a specific point to measure. This means that whatever needs to be measured needs to be directly visible, and accessible if necessary. Access can sometimes be quite difficult.
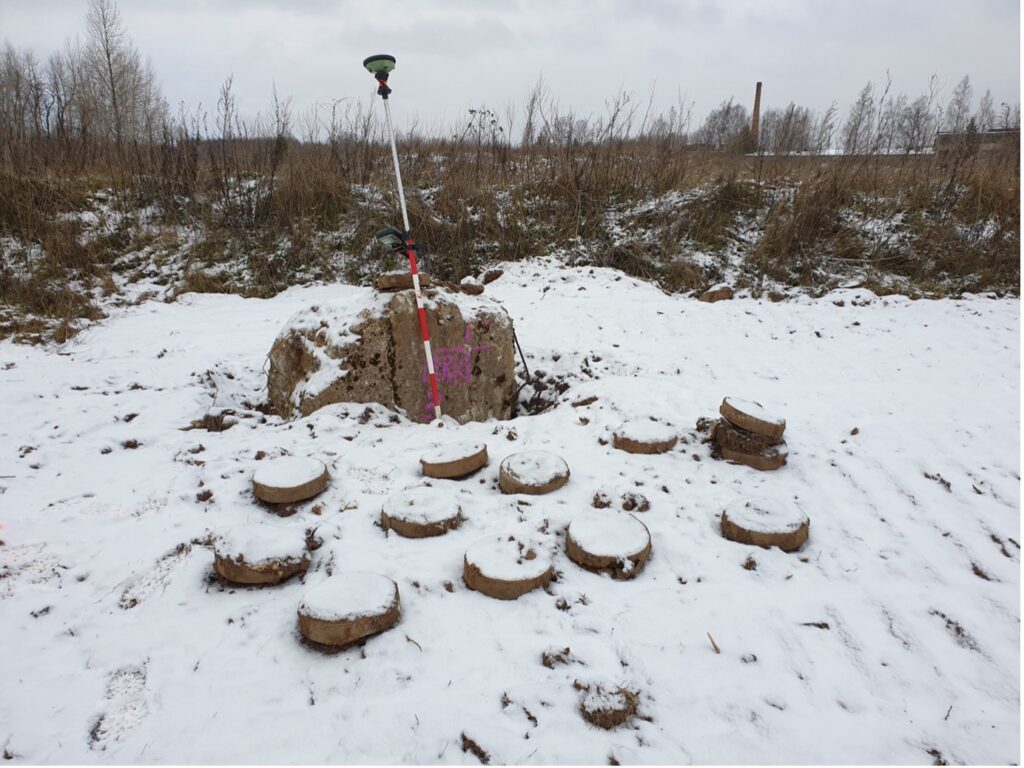
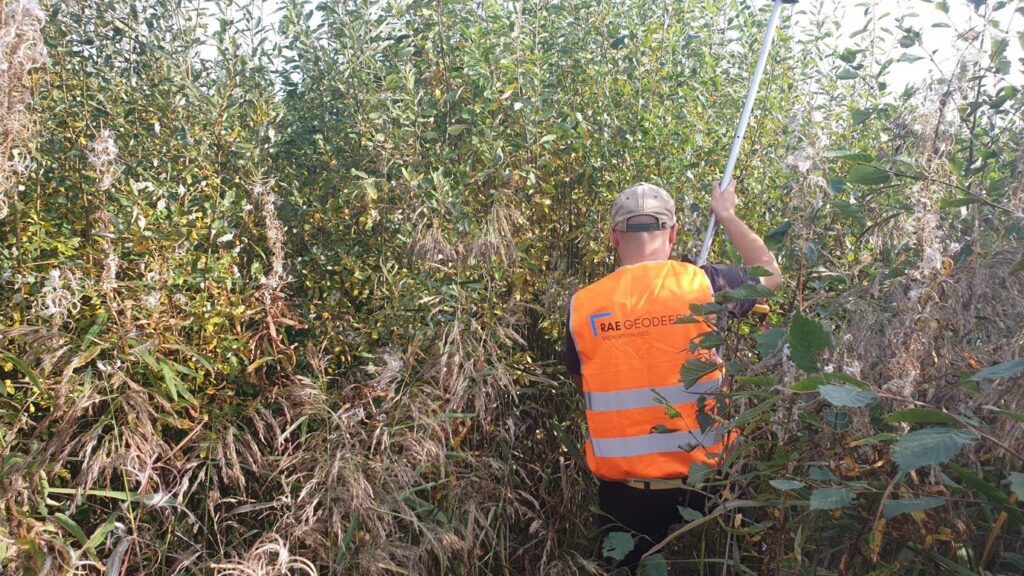
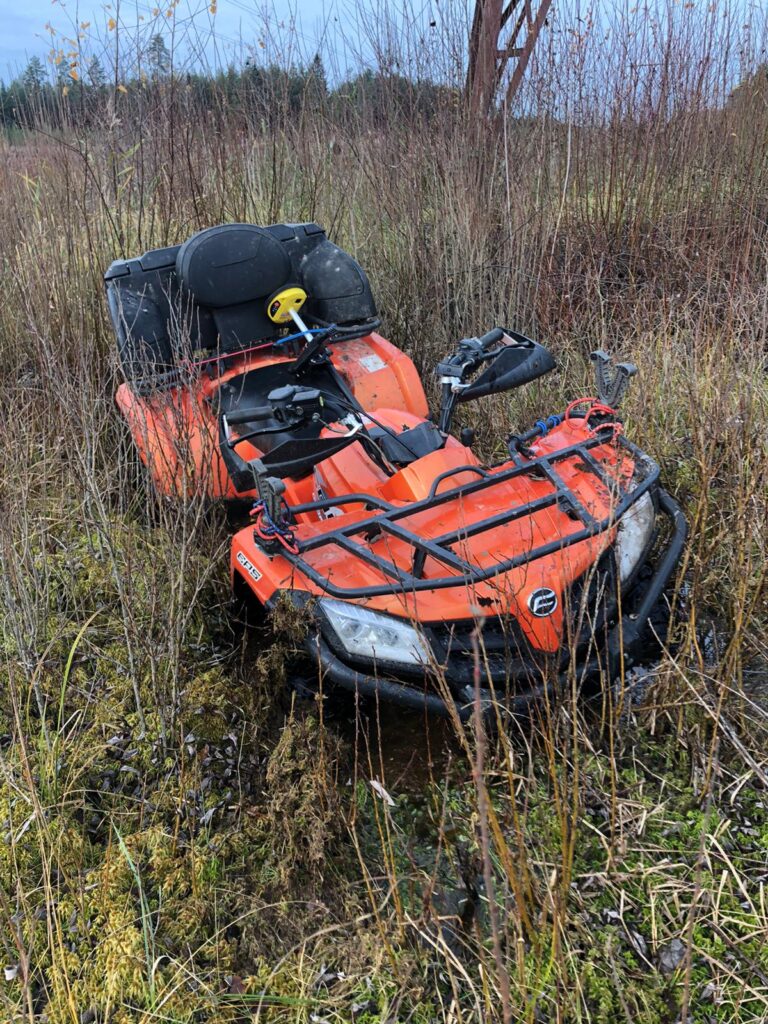
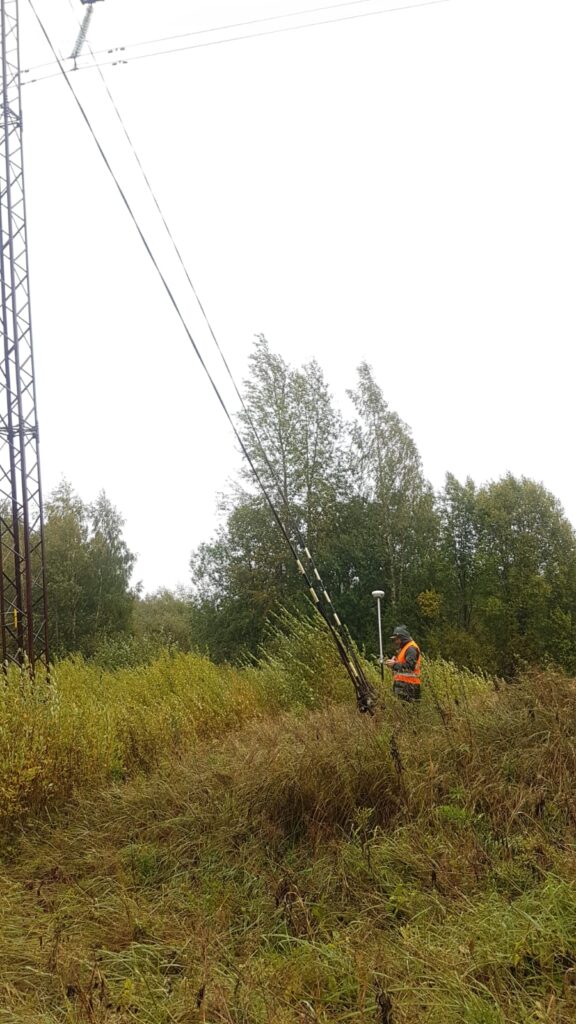
Figure 1, 2, 3, 4. Difficult access on contact measurement
The latter in turn means that some of the work is dangerous and requires the use of special equipment and additional safety measures. For example, you will need to find or install anchorages for safety fittings, hire forklifts, ladders, etc.. This makes the work more time-consuming and costly, especially when there is a lot of other machinery and people on the site.
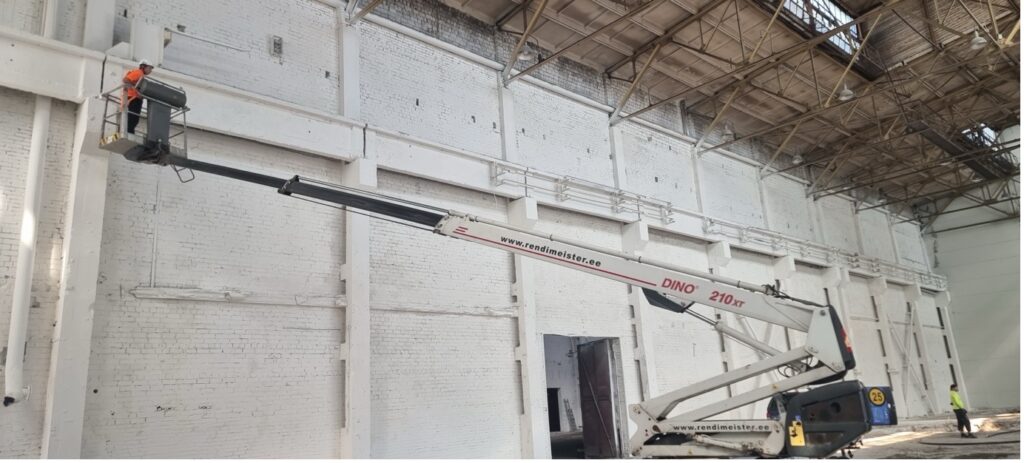
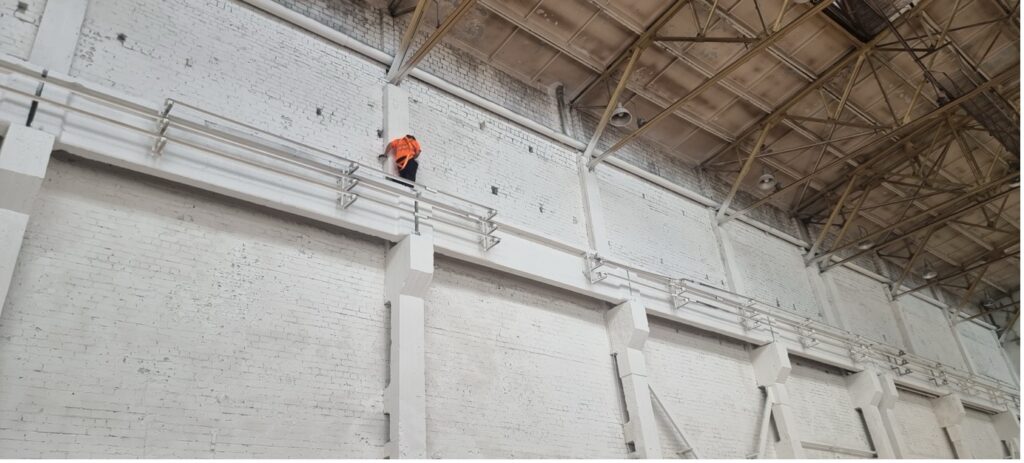
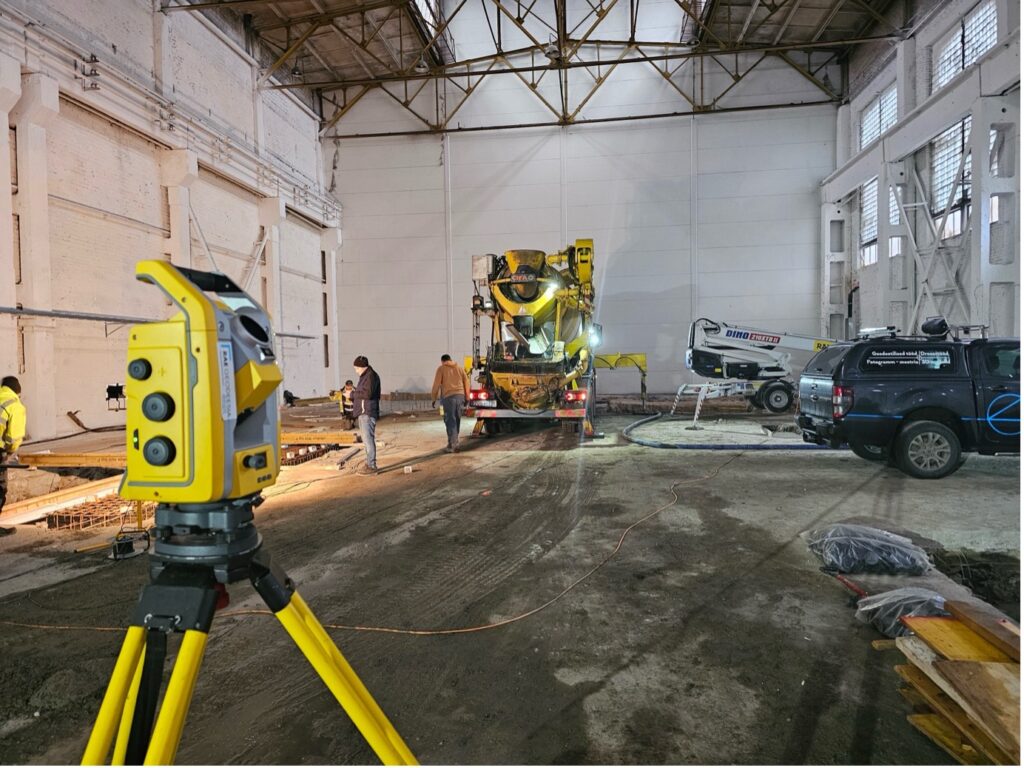
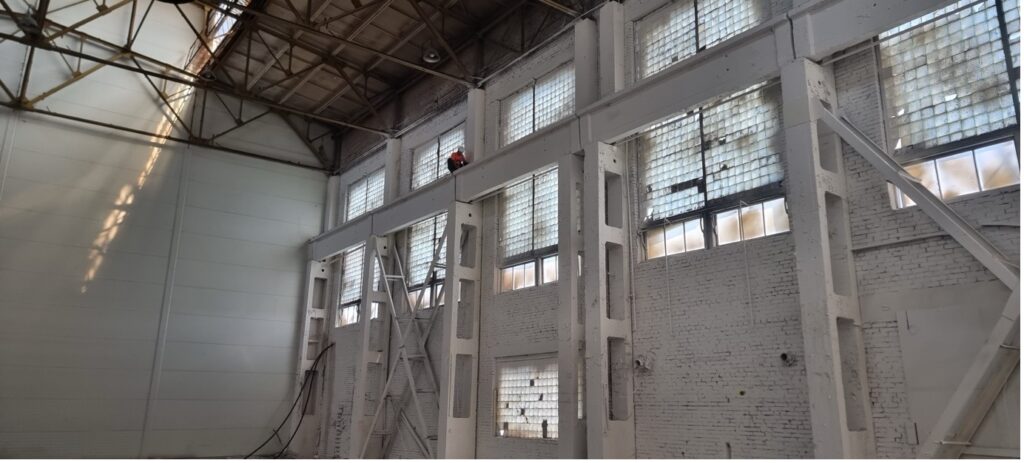
Figure 5, 6, 7, 8. Dangerous and use of special equipment
Other methods, such as laser scanning, photogrammetry, LiDAR or sonar, allow measurements to be made from a distance without necessarily visiting the point of measurement and obtaining a large amount of high quality data at once. These types of solutions can be mounted on a conventional tripod as well as on cars, boats, heavy construction equipment, trains or other mobile machinery, and of course on (unmanned) aircraft. Be they multi-rotors, aeroplanes, helicopters, or for me, hot air balloons. All of this makes it possible to get the job done faster, safer and with fewer resources. The subject of this post, however, is unmanned aerial work, so I will write a bit more about that. One of the most common ways of collecting data is photogrammetry, which is also part of our daily work.
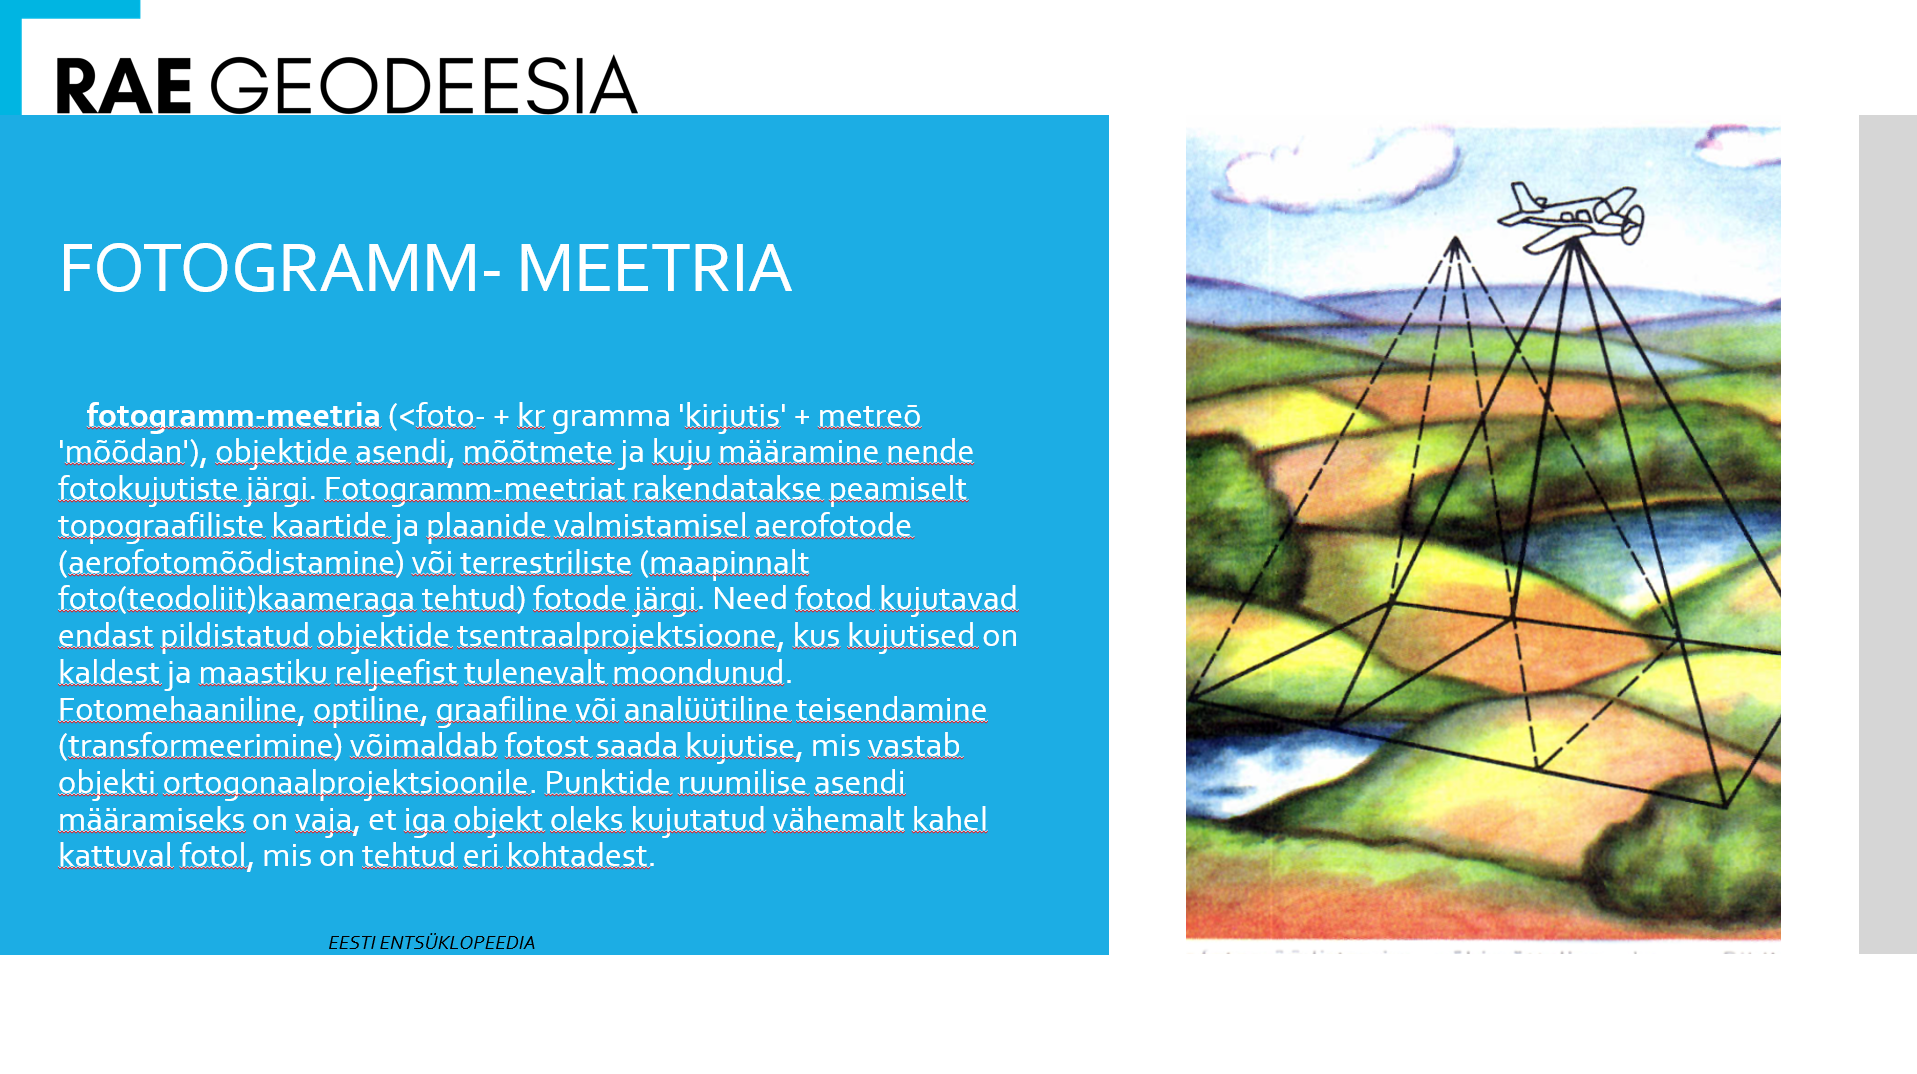
Figure 9. Definition of photogram metric from the Estonian Encyclopaedia.
Often the trainees are most looking forward to seeing what a drone fieldwork for photogrammetry looks like, and when they do they are disappointed because what happens during the flight is anything but exciting – just a speck in the sky that automatically moves backwards. In reality, the most important parts are the ones that precede the take-off. From obtaining all the necessary approvals and permissions to planning the specific flight. For a photogrammetric survey, depending on the purpose of the work, a flight plan has to be put in place, with pre-set flight trajectory, camera angle, photo overlays, etc. The fleet we use (DJI M300 RTK+DJI P1 full frame camera, or DJI Phantom 4 RTKs in the past) has made these tasks relatively simple and easy to plan.
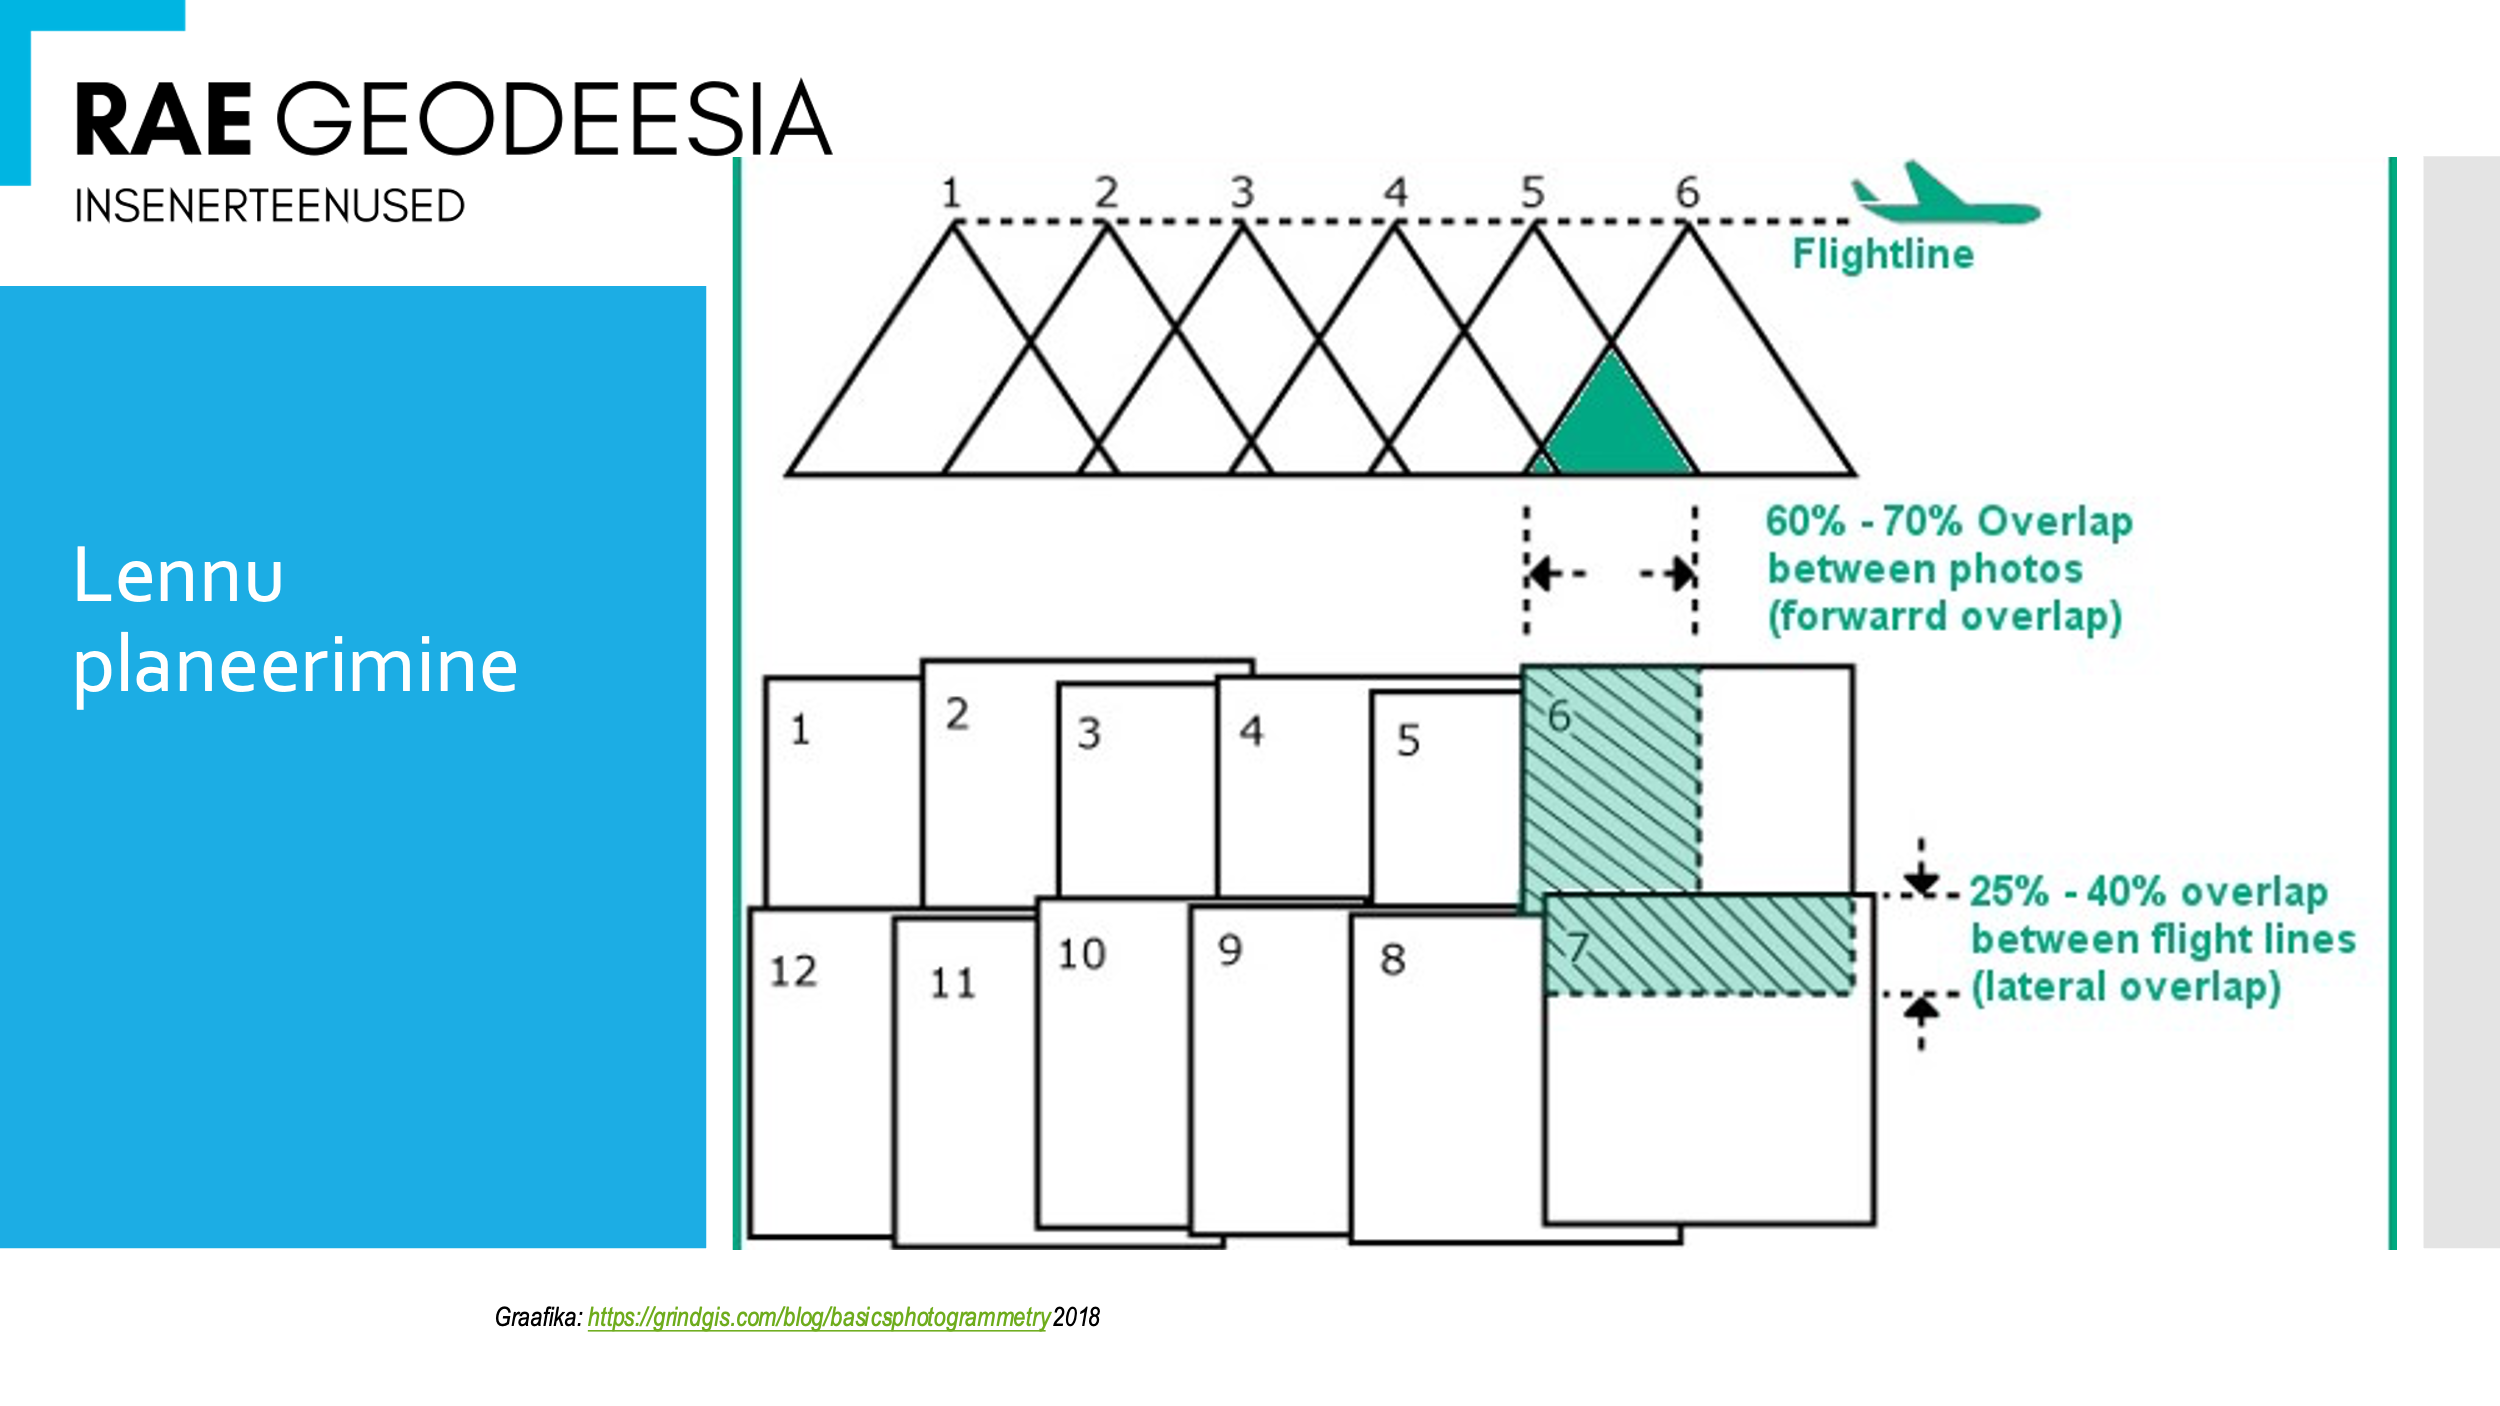
Figure 10. flight planning
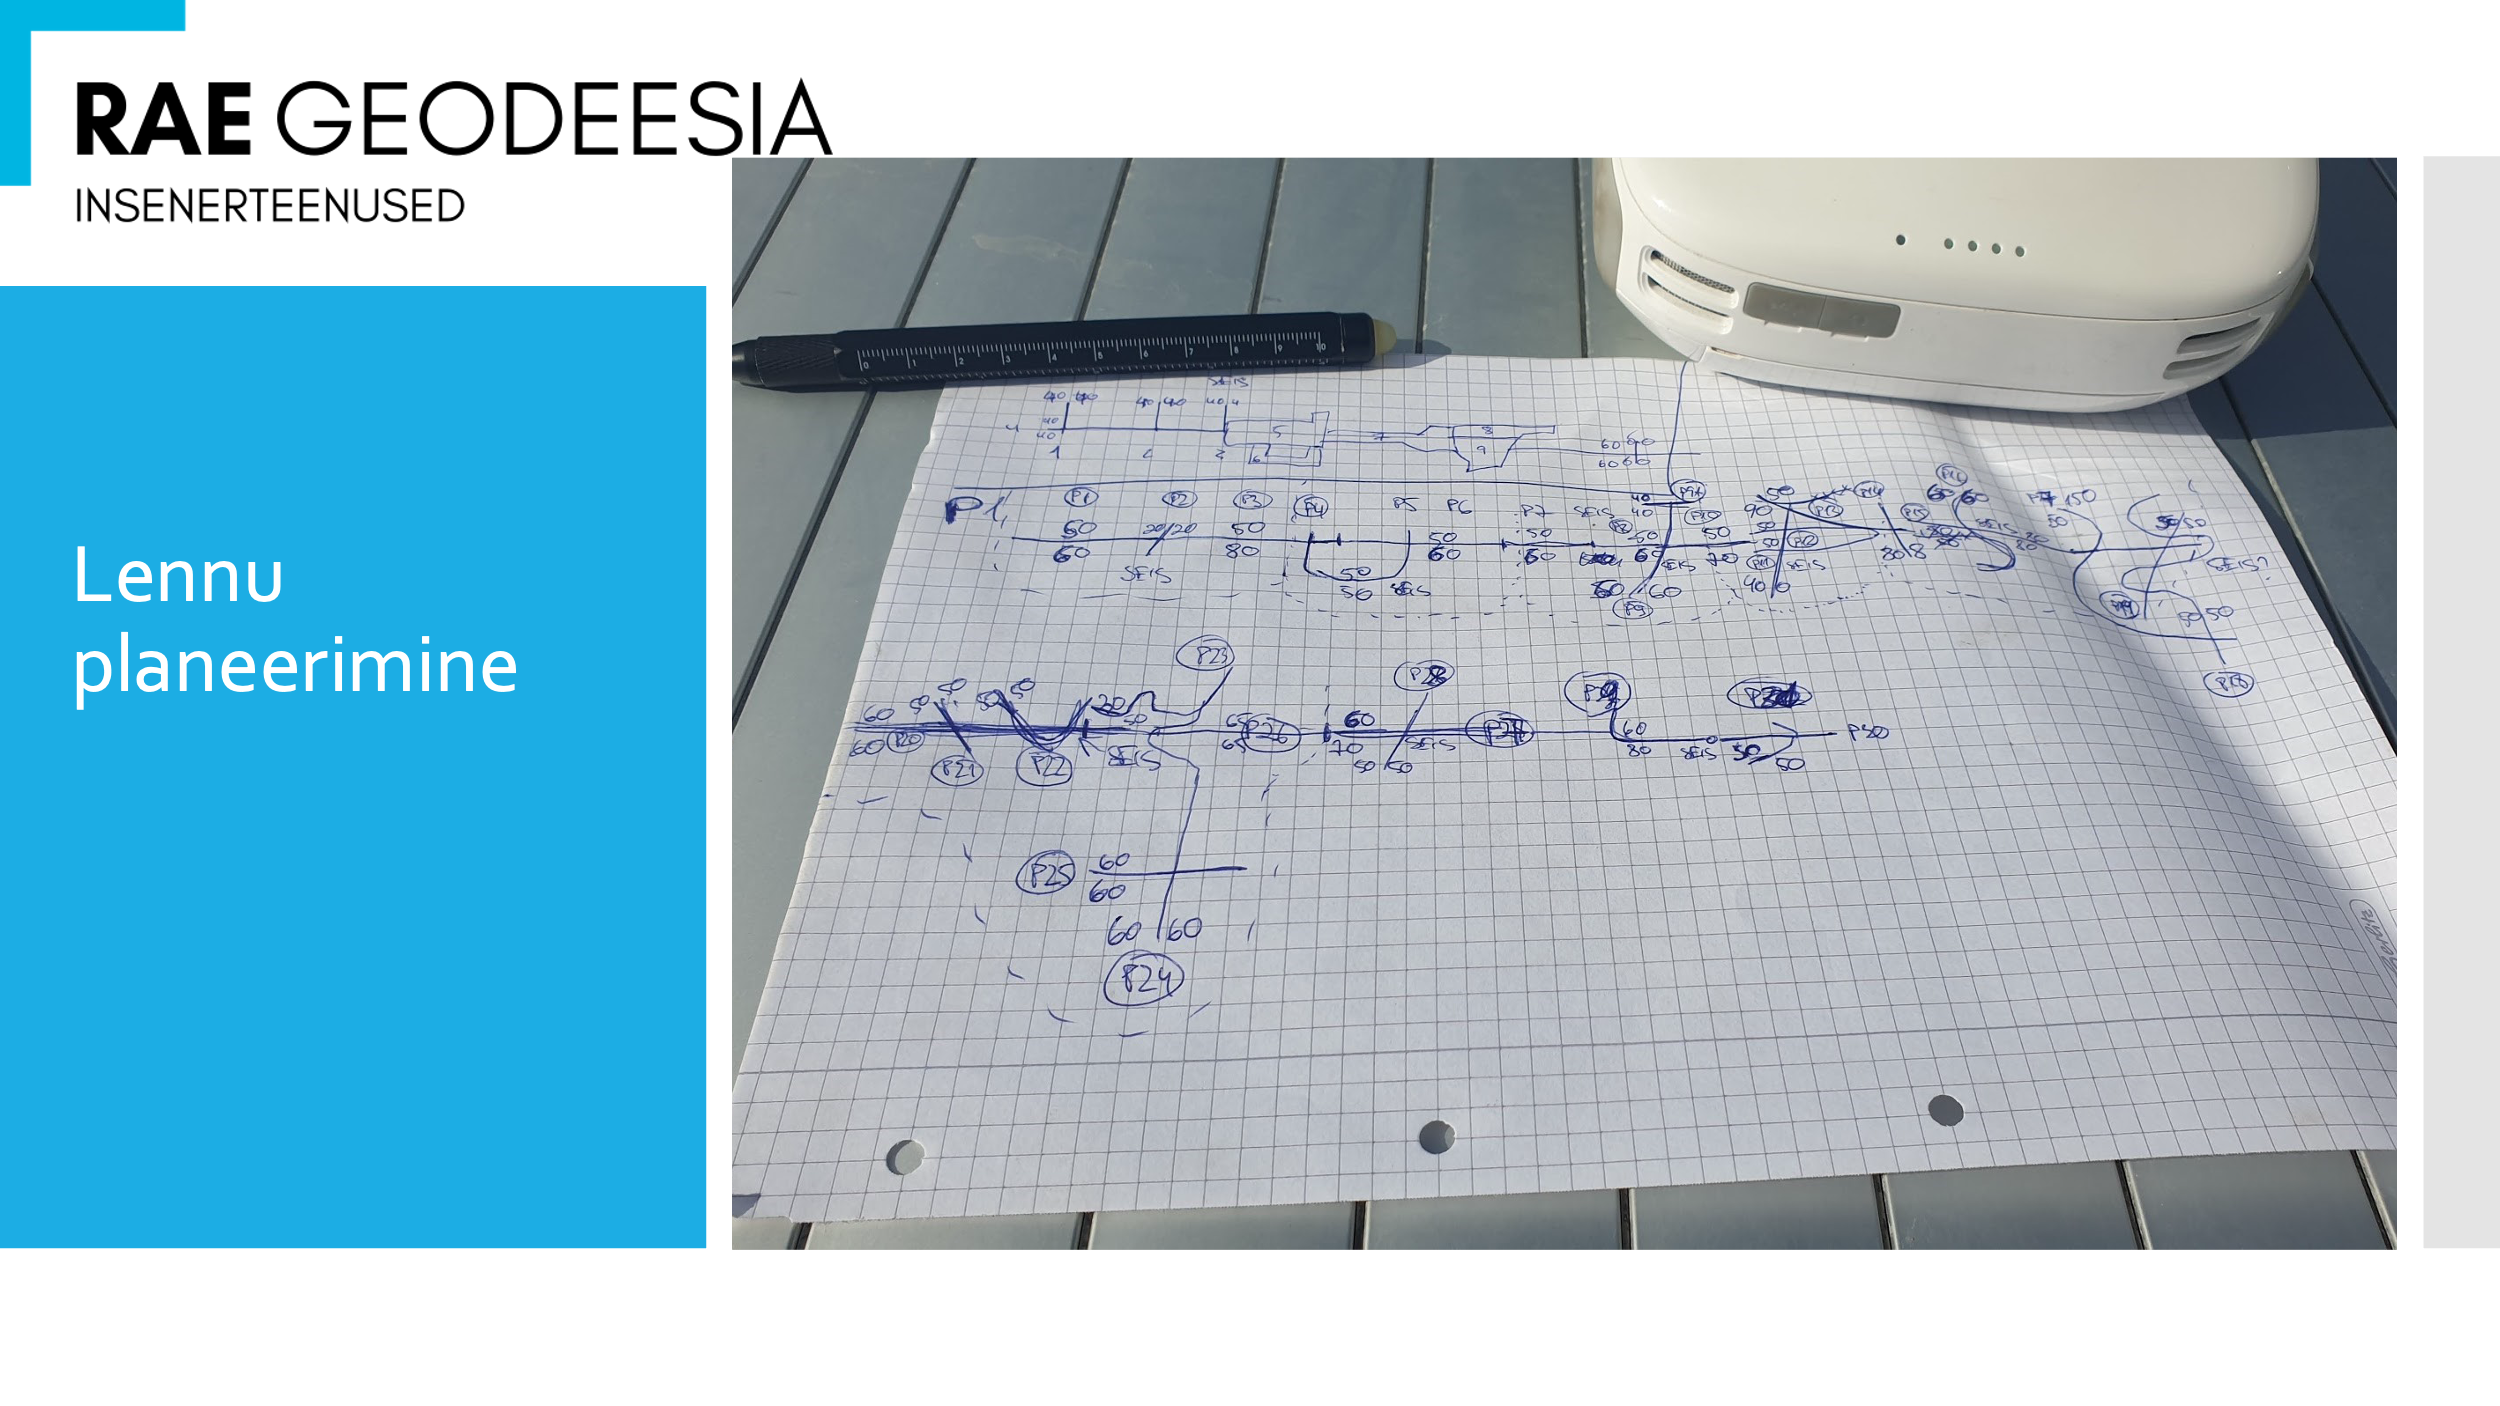
Figure 11. flight plan
Once the planned flights are done, at the end of a successful working day we will have approx. 500GB or more of photos (i.e. sometimes 20 000+ photos), which we start processing in a dedicated workstation. By completing the processing, the output of the job is a point cloud, relief image, orthophoto, 3D model or other such output. From these outputs, we can draw up working drawings, calculate volumes, design projects, analyse vegetation and do many other things that the client might not know at first glance. You can see the results of such a work process using the map applications of the Estonian Land Survey and Google Maps, for example.
Figure 12. orthophoto
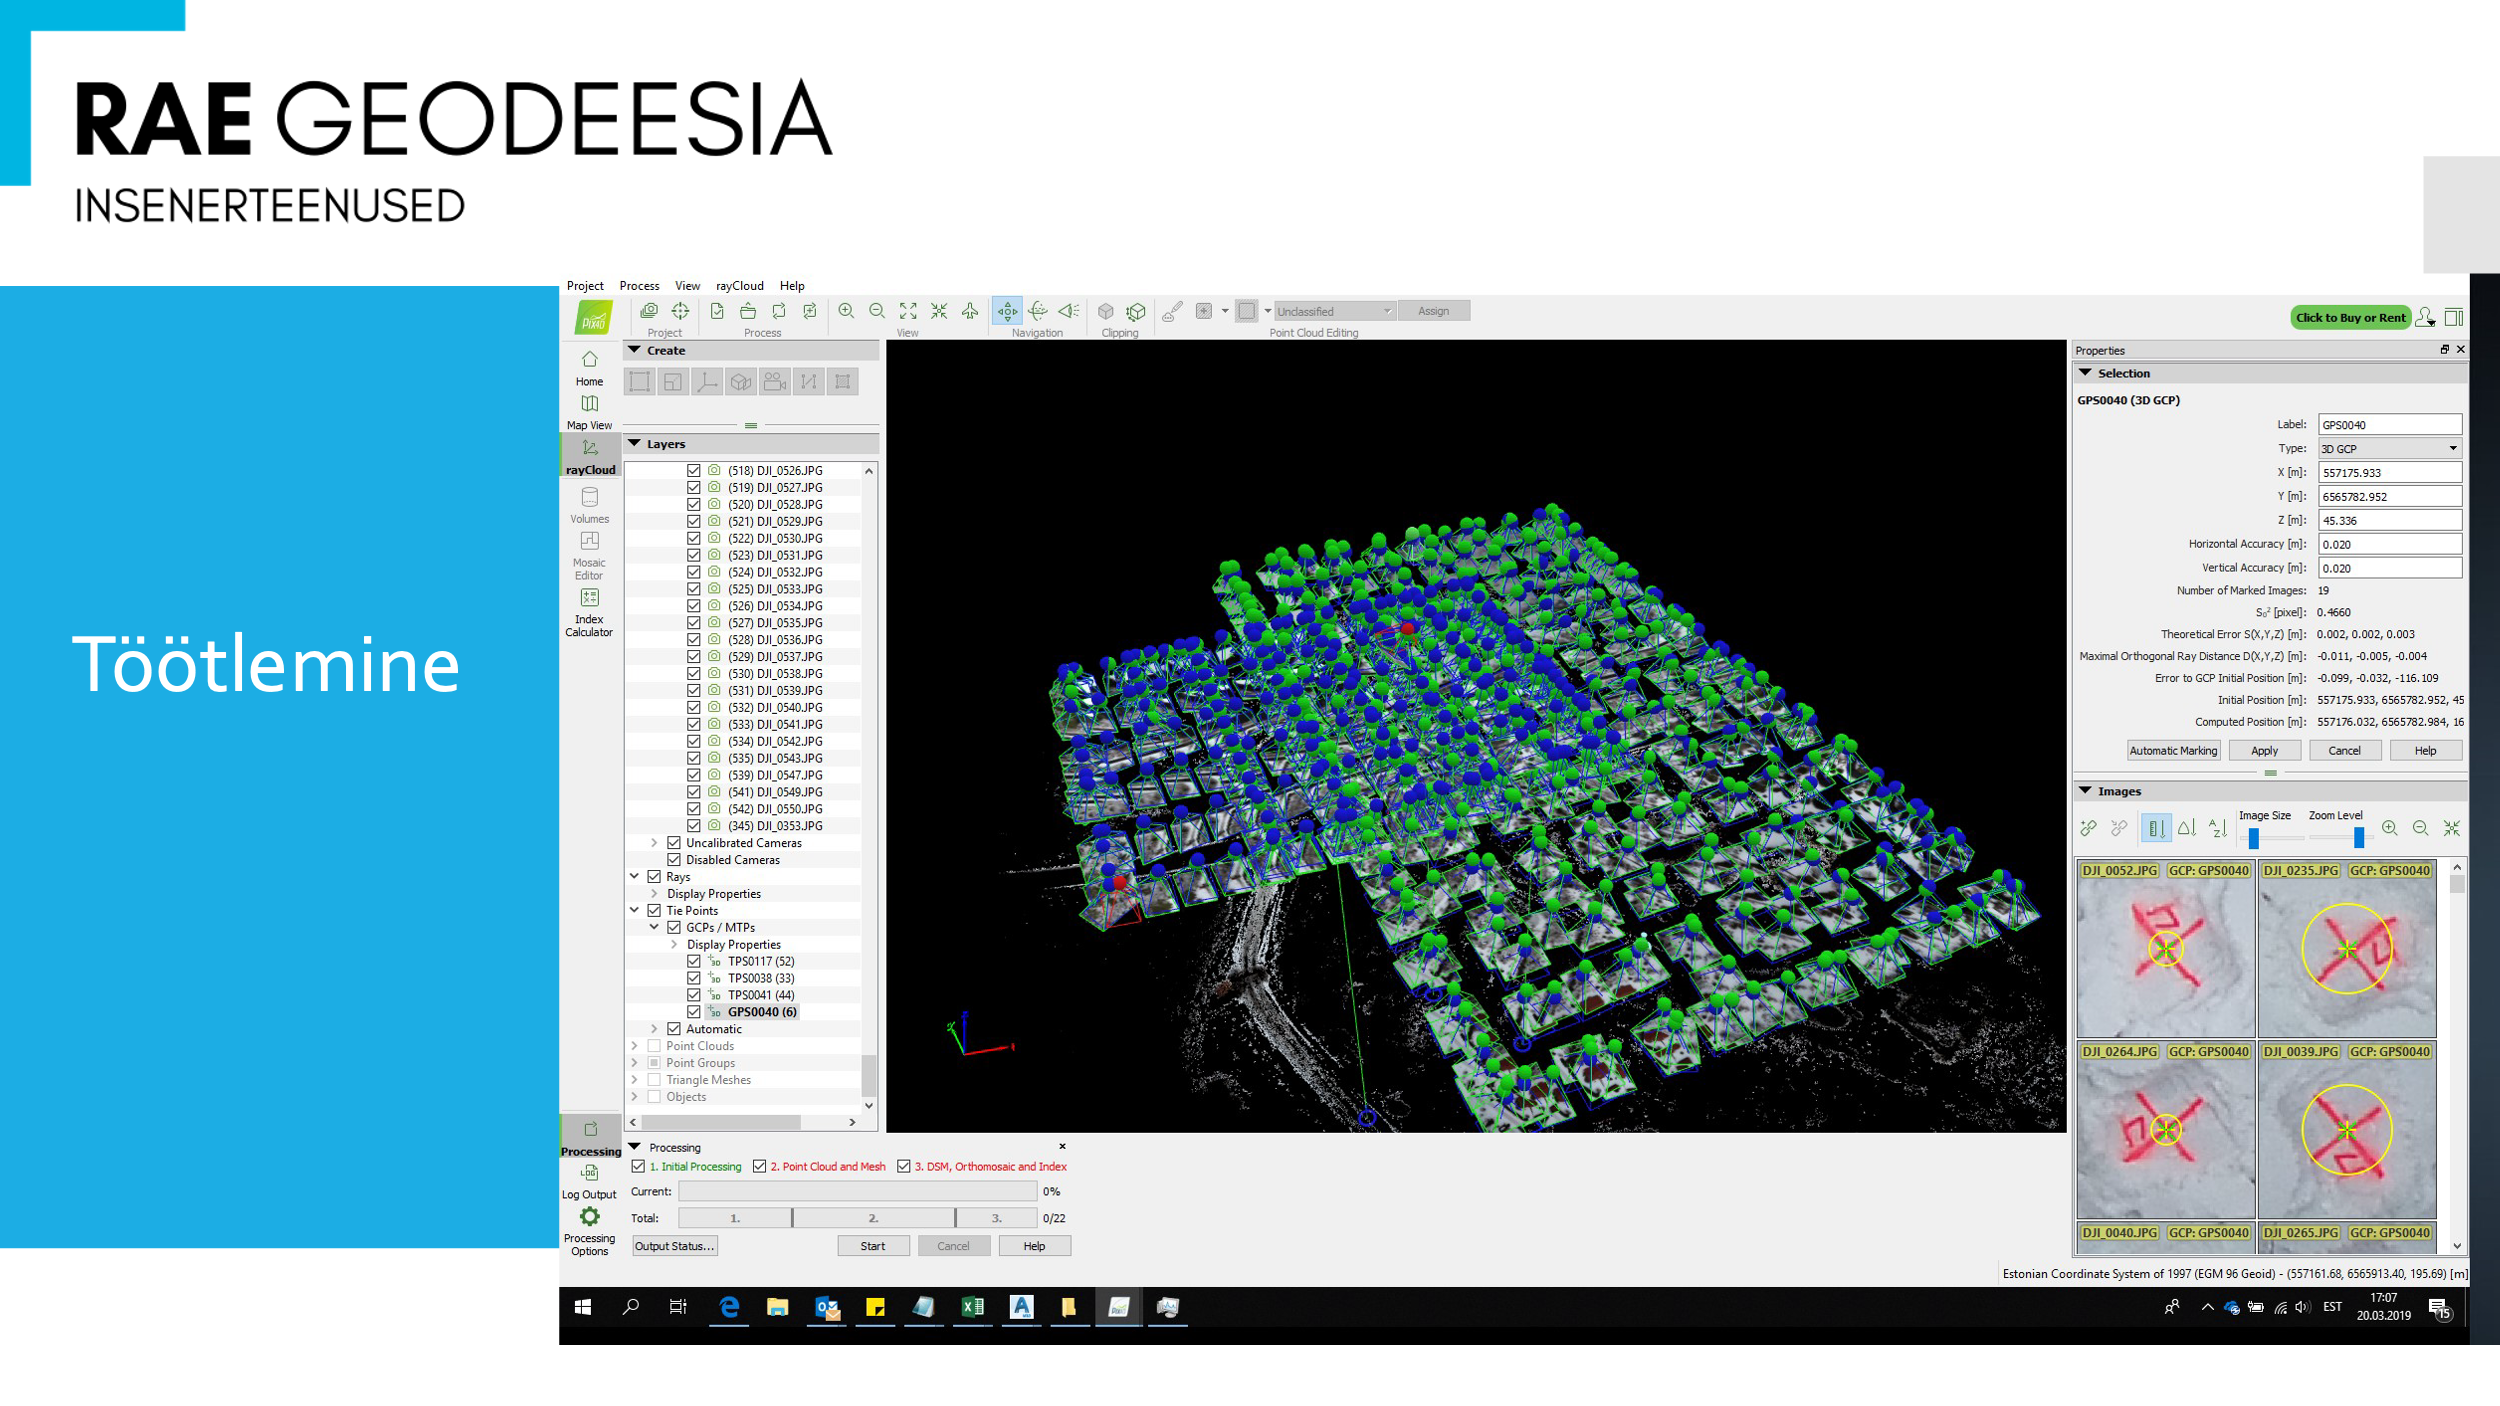
Figure 13. processing
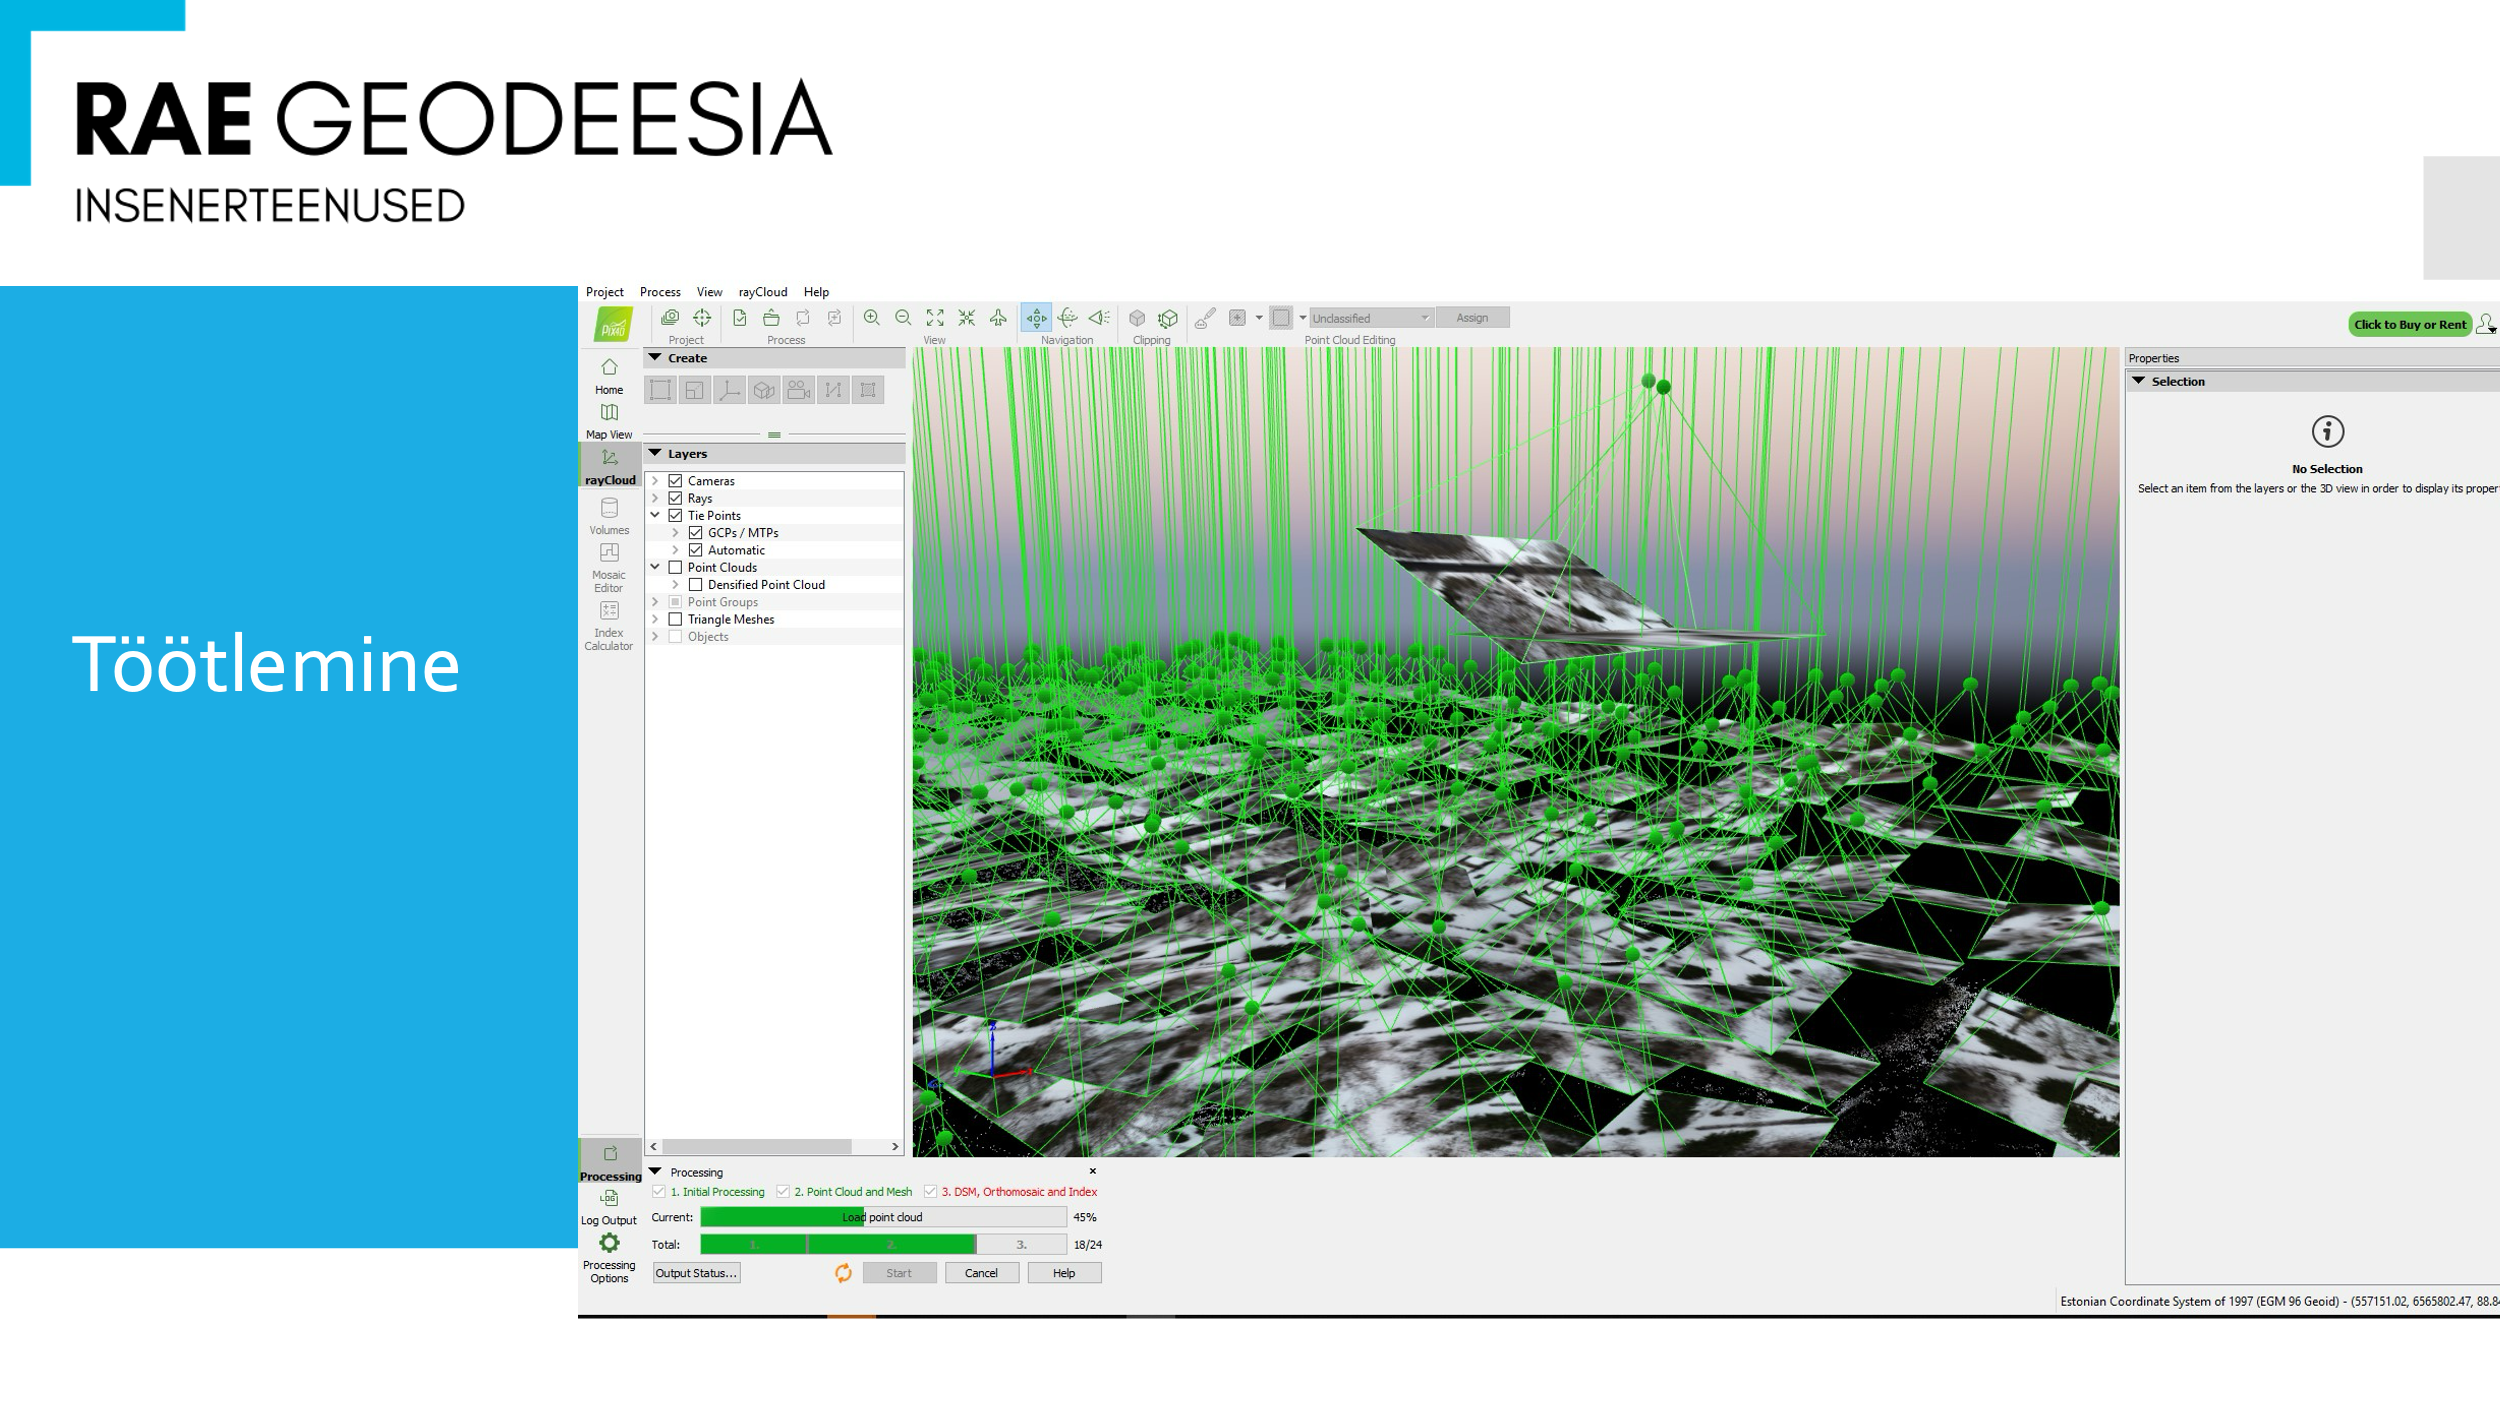
Figure 14. processing
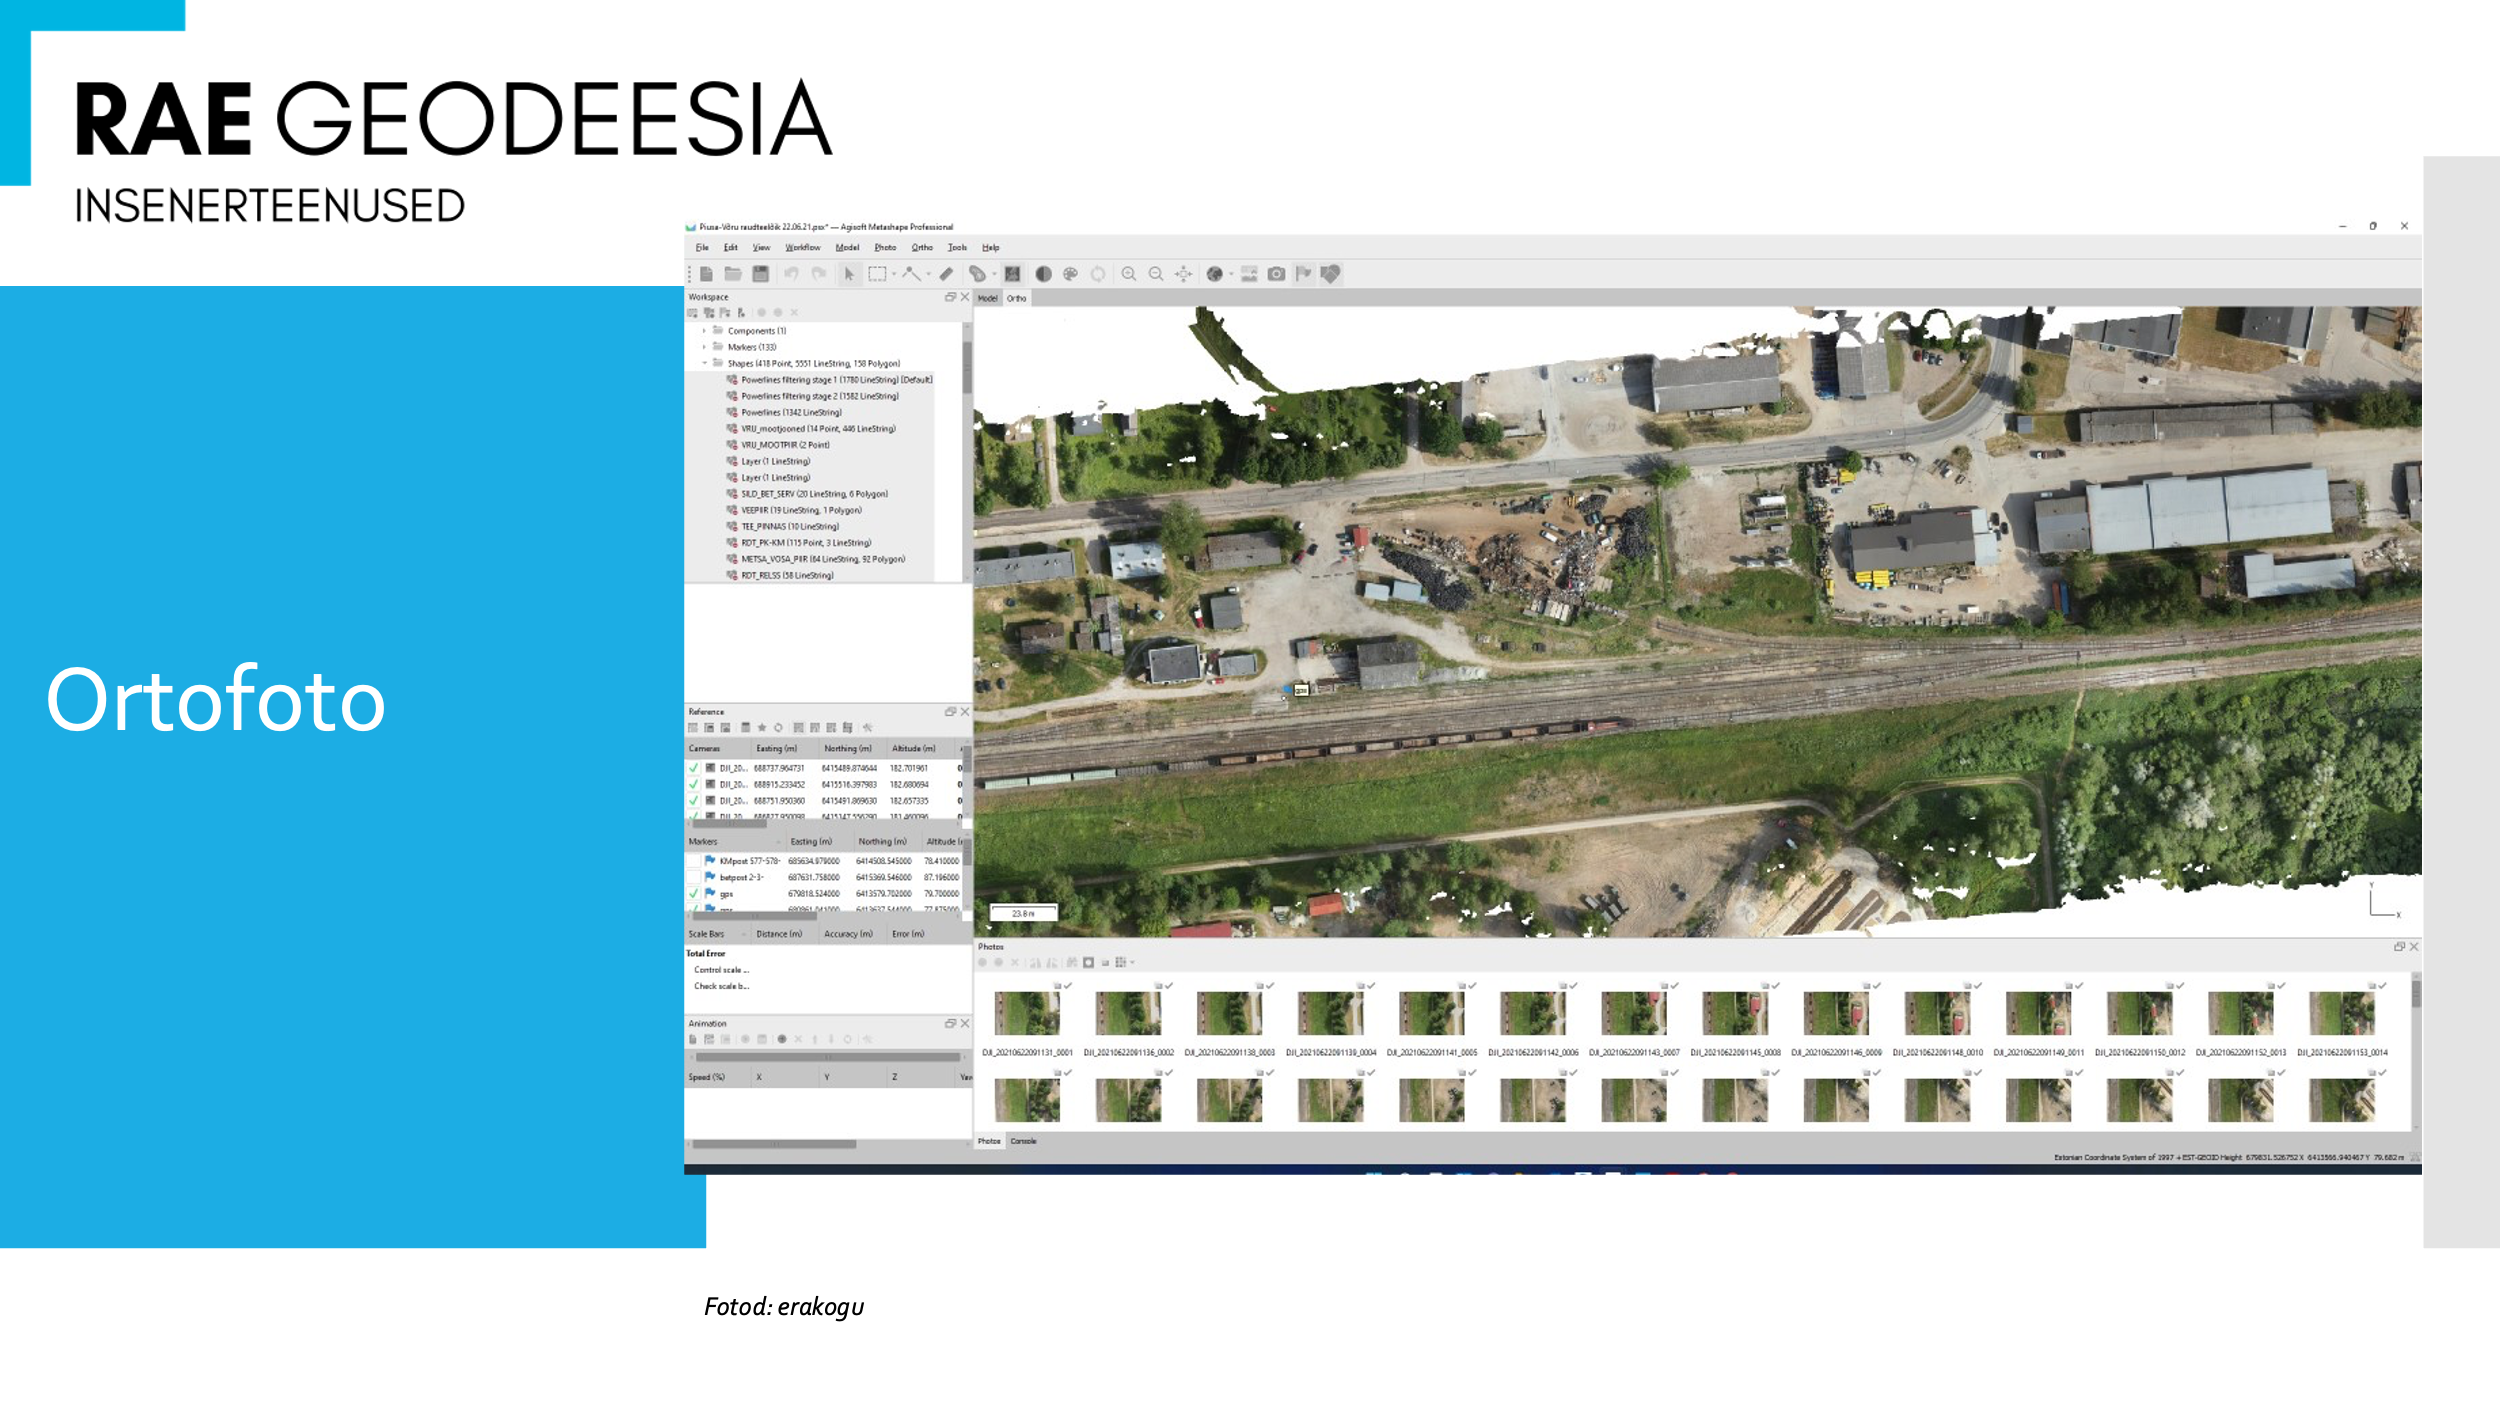
Figure 15. orthophoto
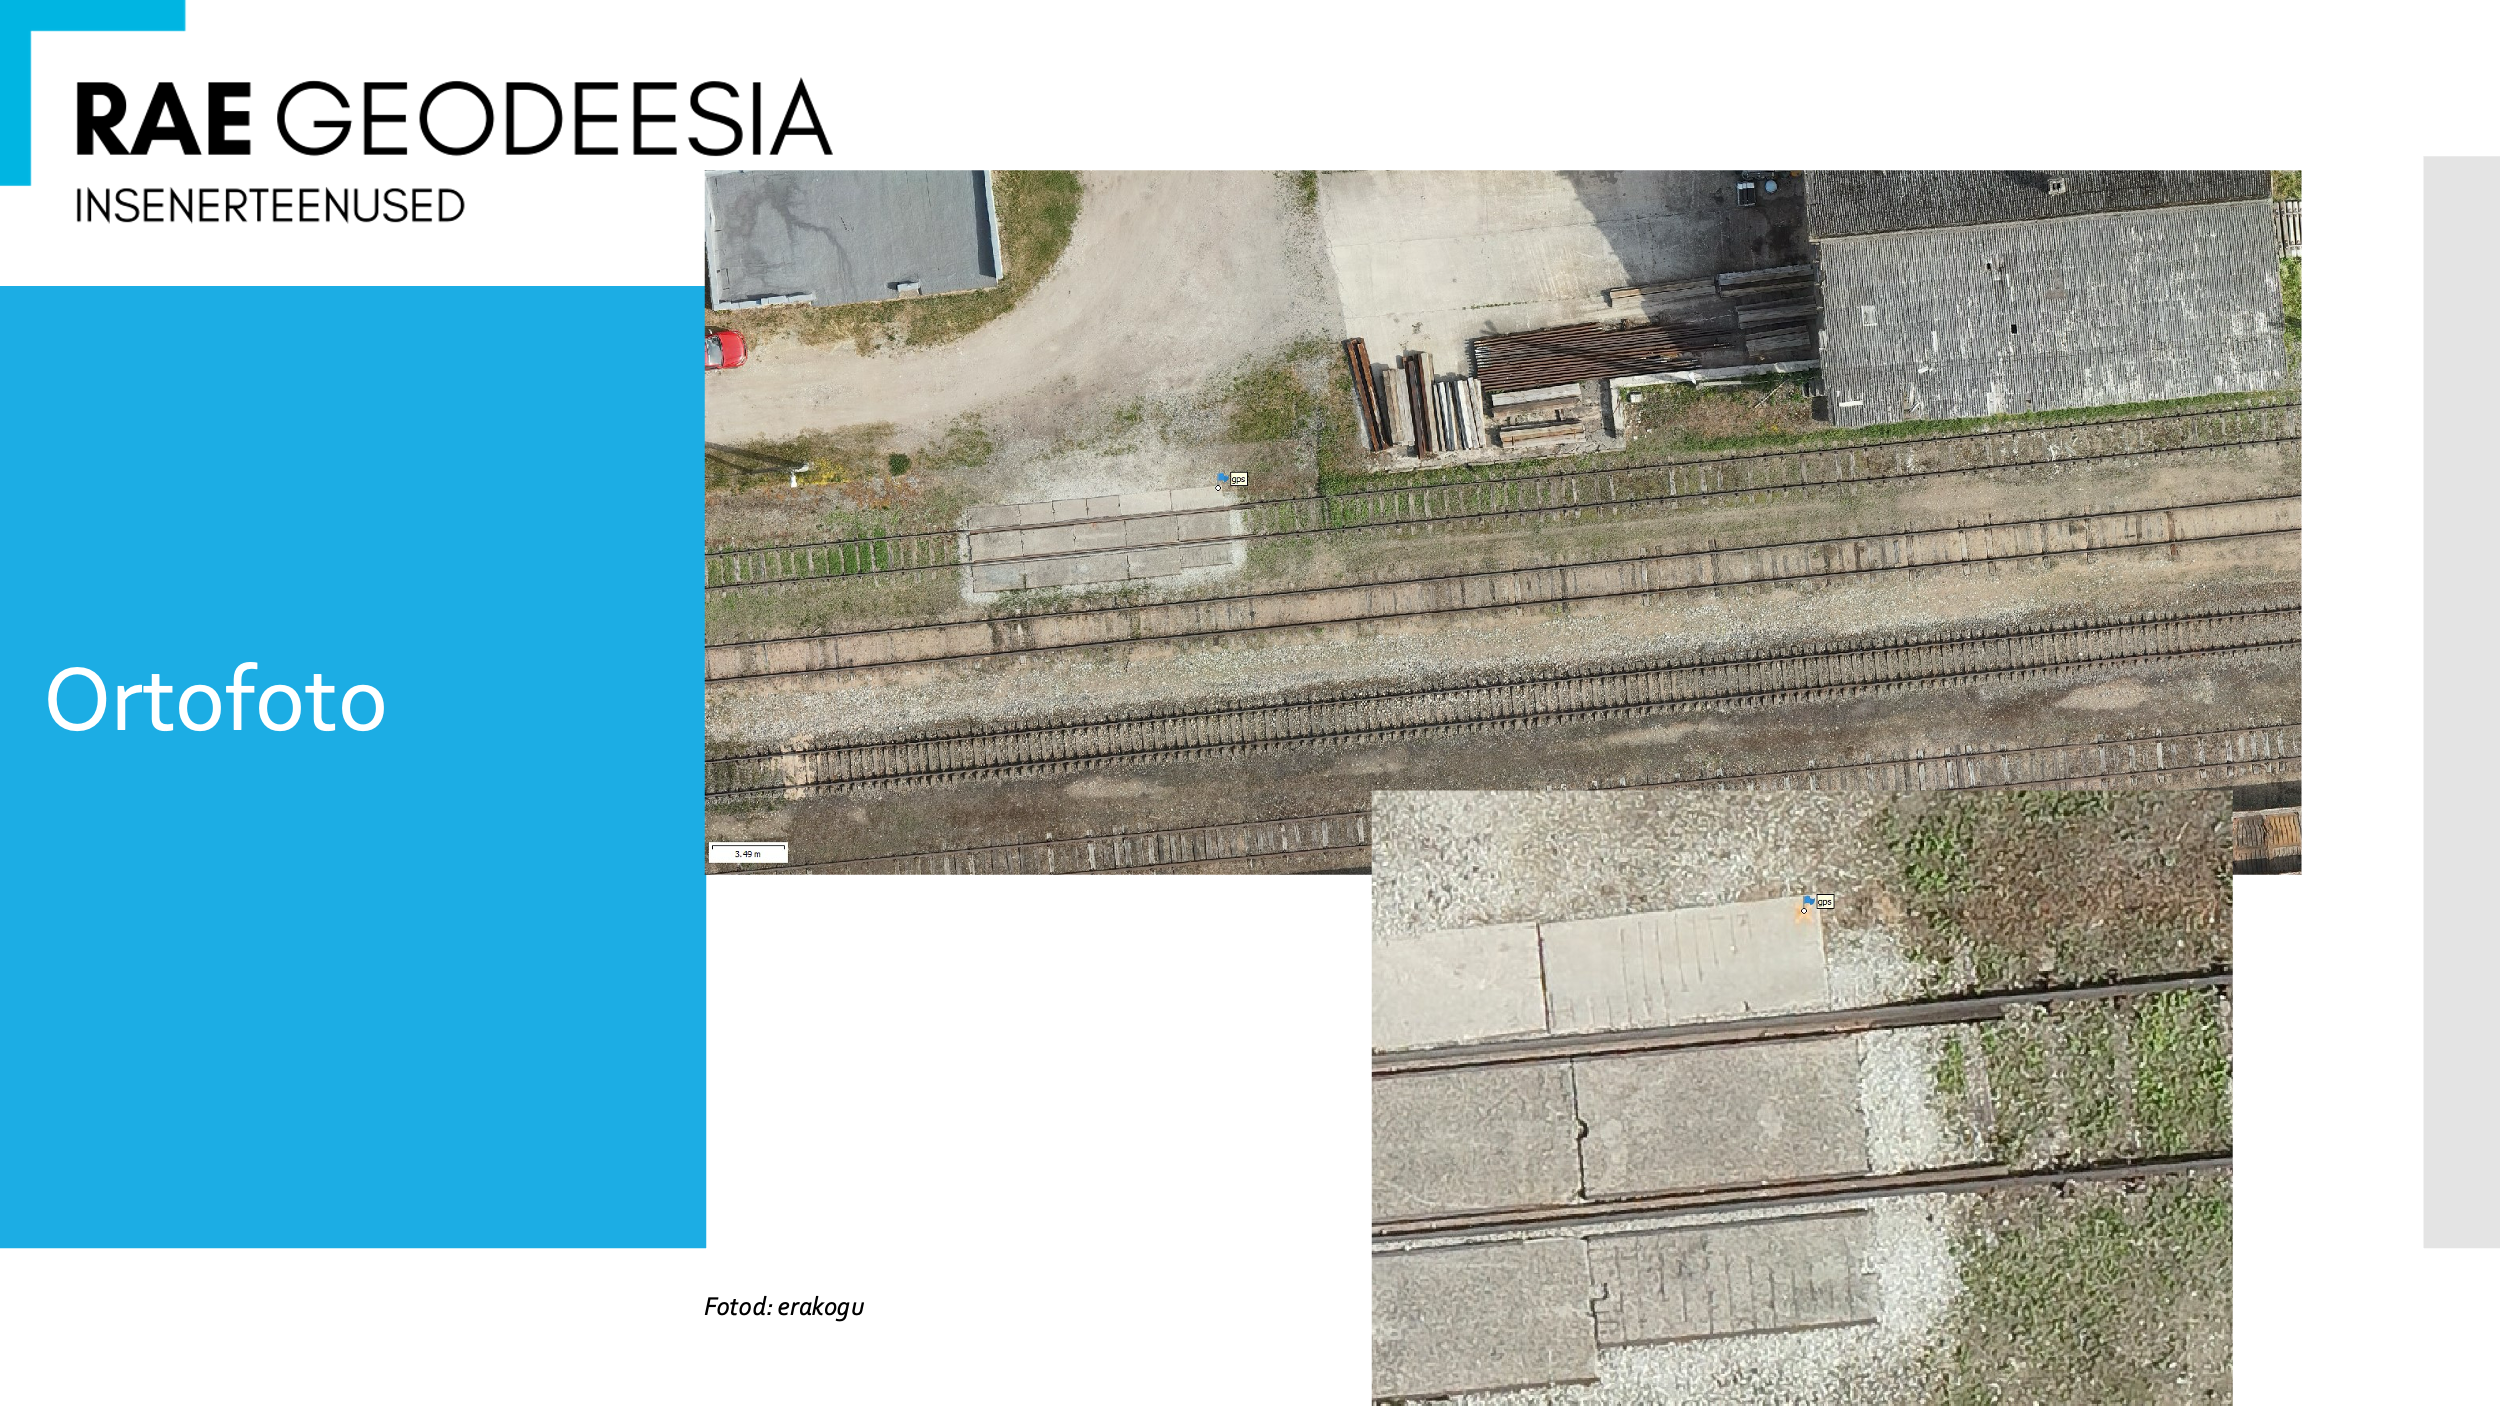
Figure 16. orthophoto
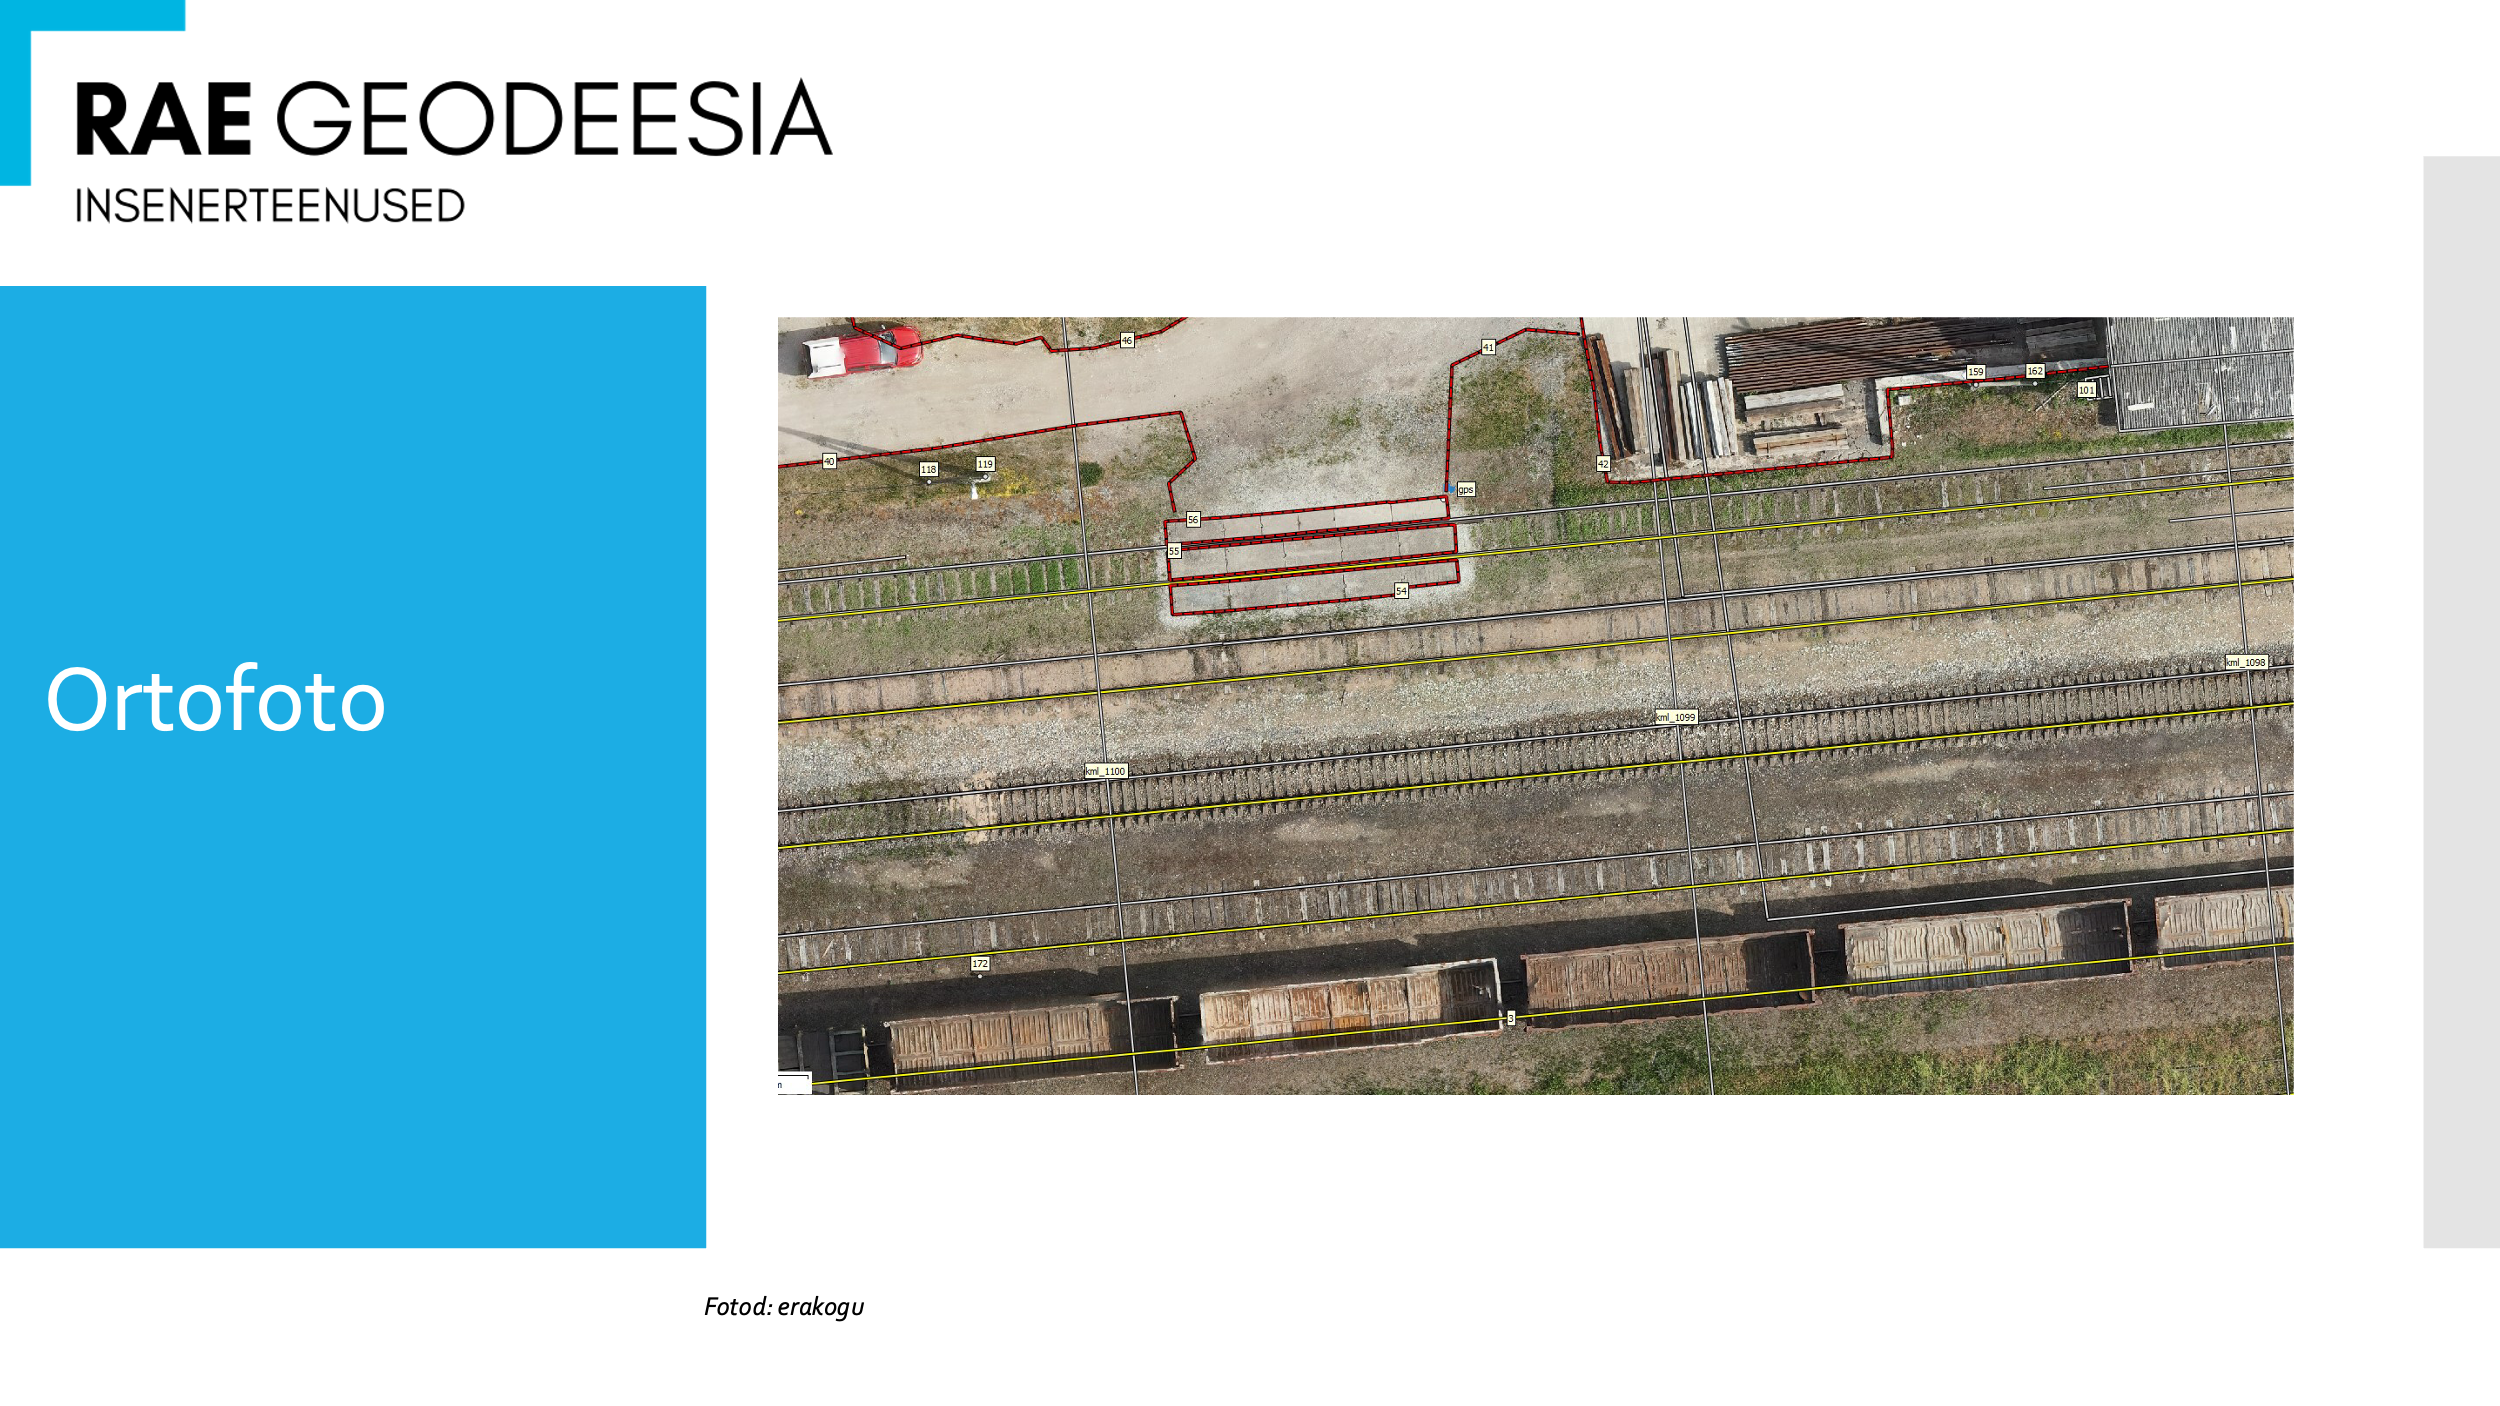
Figure 17. orthophoto
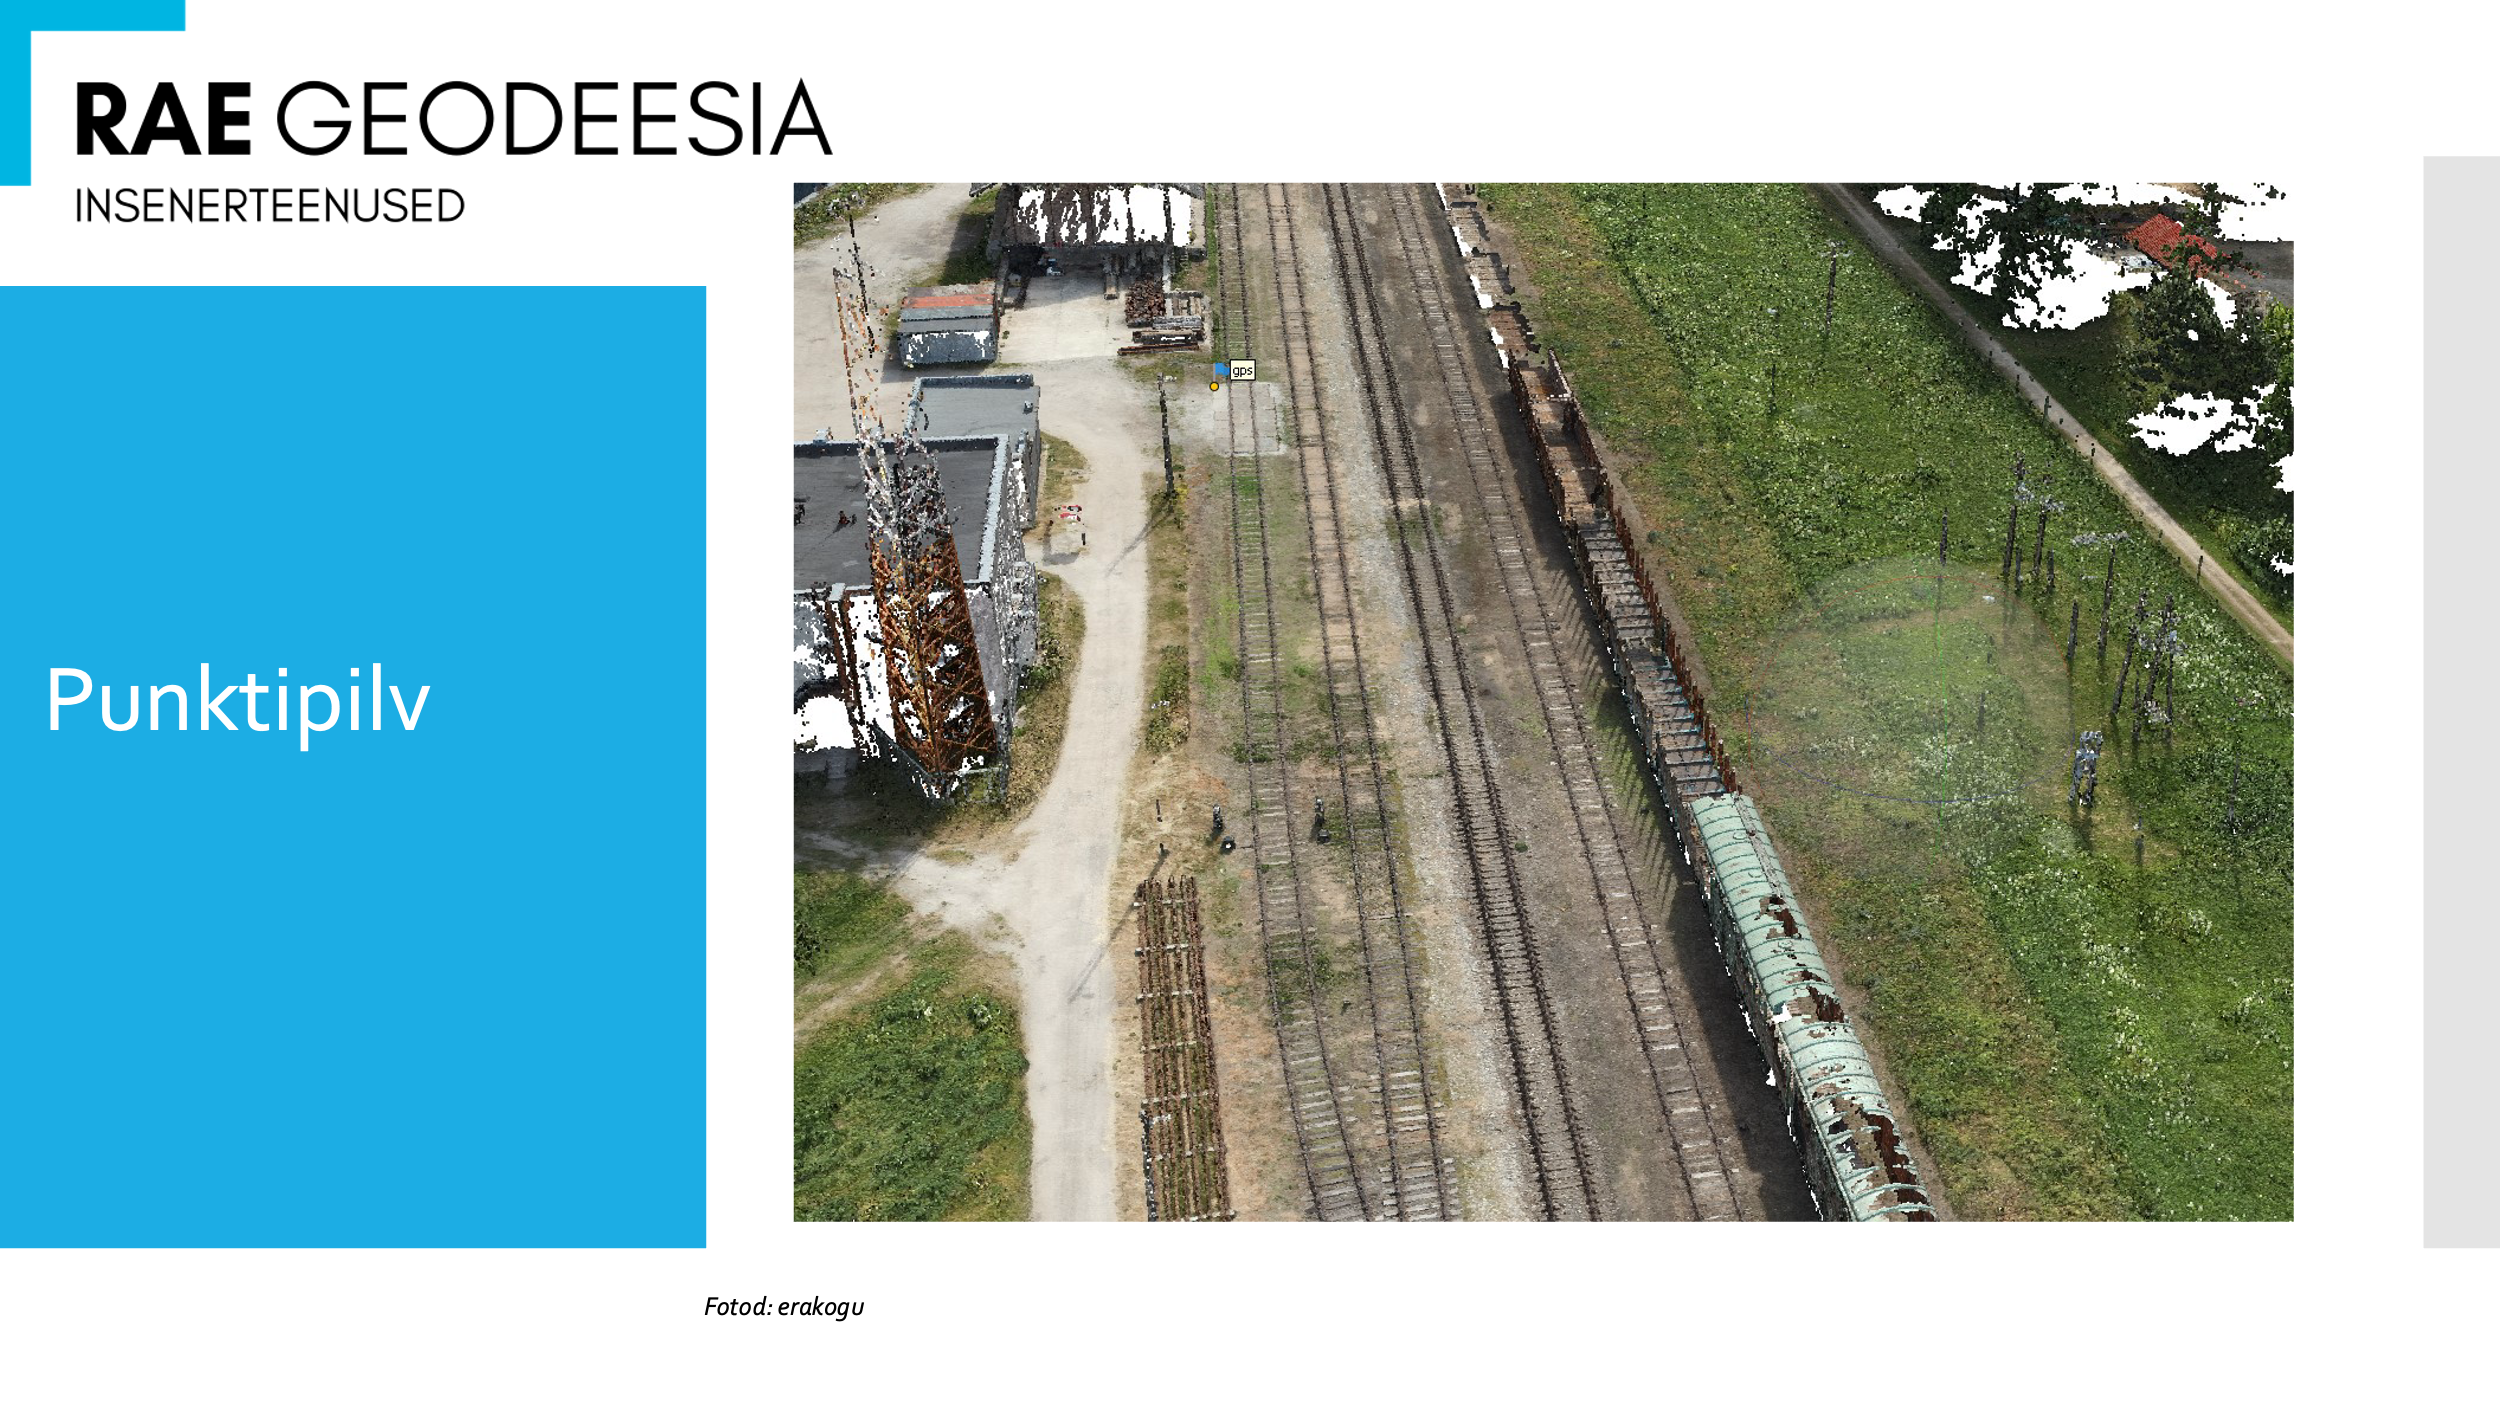
Figure 18. point cloud
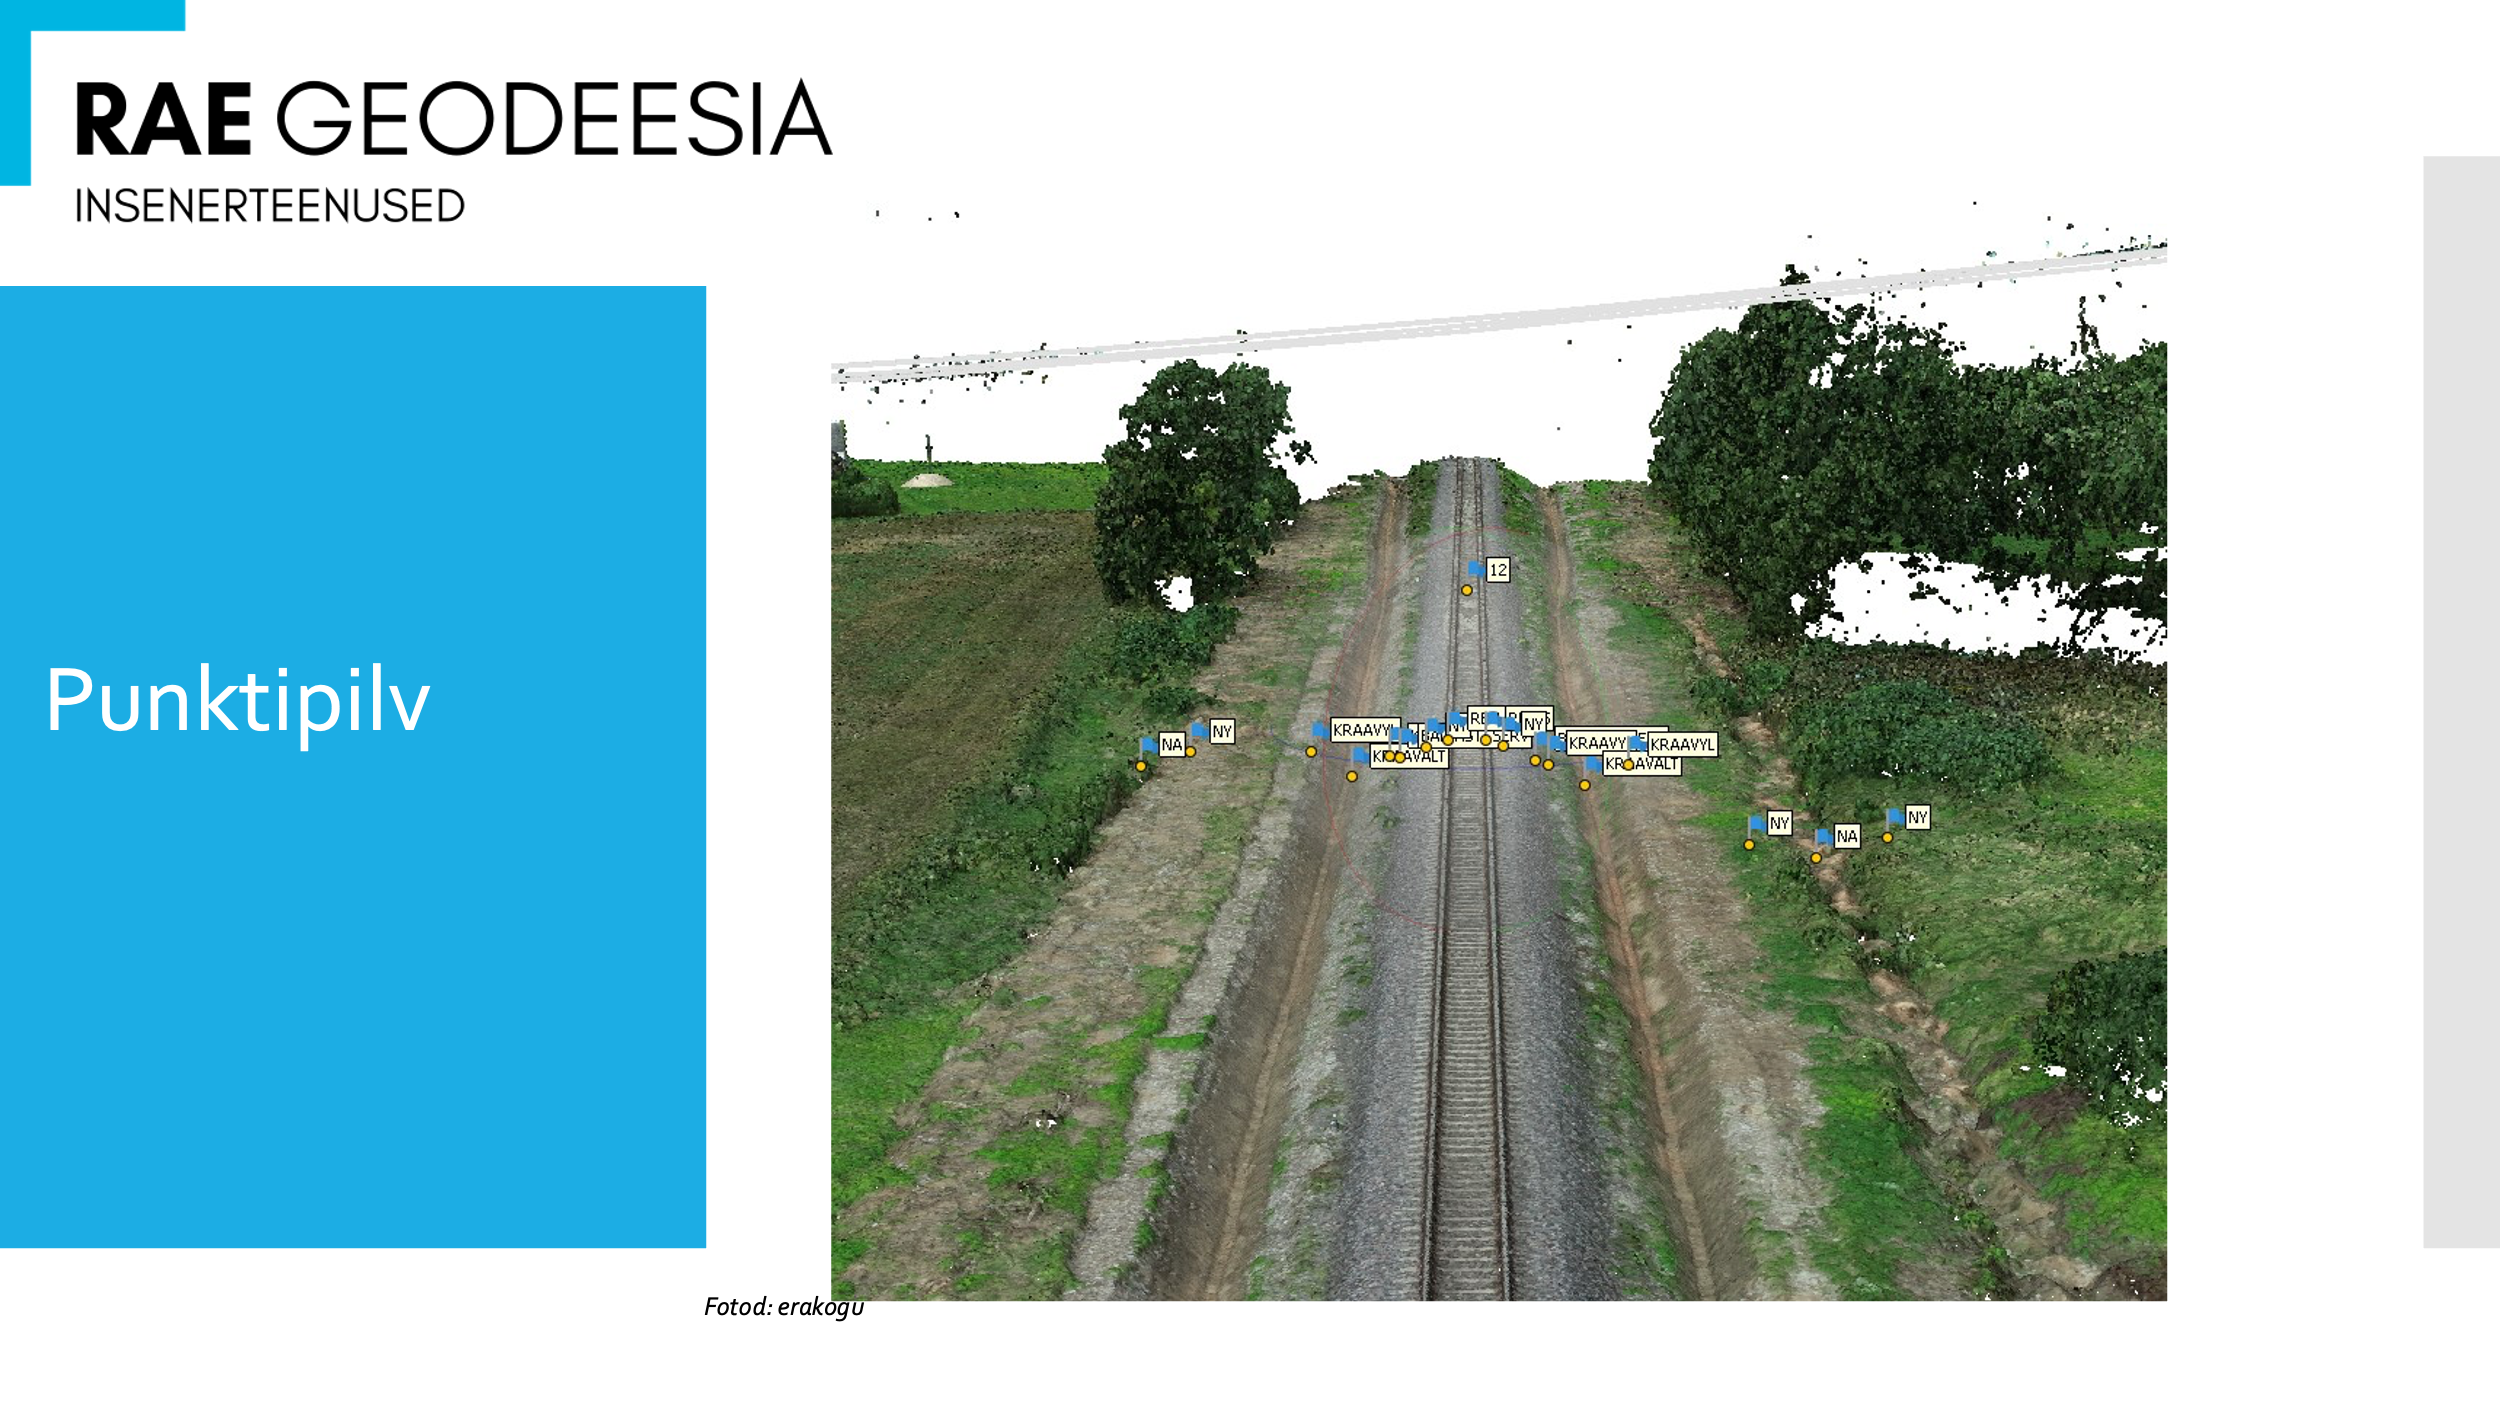
Figure 19. point cloud
The photogrammetric workflow allows us to measure large areas relatively quickly and with a fairly high degree of accuracy. If the work is done correctly, the accuracy of the results is within a few centimetres. But there are situations where using LiDAR has advantages.
- LiDAR’s work is based on the calculation of three-dimensional coordinates from a reflected laser pulse. Scanning can be done from an aircraft (aerial scanning) or from the ground. LiDAR sends out a pulse of light which is reflected back into the device when it reaches the target. Since laser scanning operates at a speed of light of about 0.3 m/ns, it is possible to calculate the length of the propagation path of the light beam from the device to the surface from which it is reflected back.
- One of the most common applications of LiDAR is in the production of detailed maps and surface models used in geography, geology, geodesy, geomorphology, but also in atmospheric physics, forestry, agriculture and environmental studies. In this case, it is a remote sensing of the Earth’s surface.[1]
Figure 20. Lidar https://et.wikipedia.org/wiki/Lidar
Using LiDAR, we can also obtain a point cloud, an elevation model and, under certain conditions, an orthophoto, but the advantages of LiDAR come to the fore when it would be difficult to work with photogrammetry, or would give an incomplete result. For example, when we need to survey in a way that the area to be surveyed is not clearly visible to the eye – the ground is hidden by trees, grass or bushes.
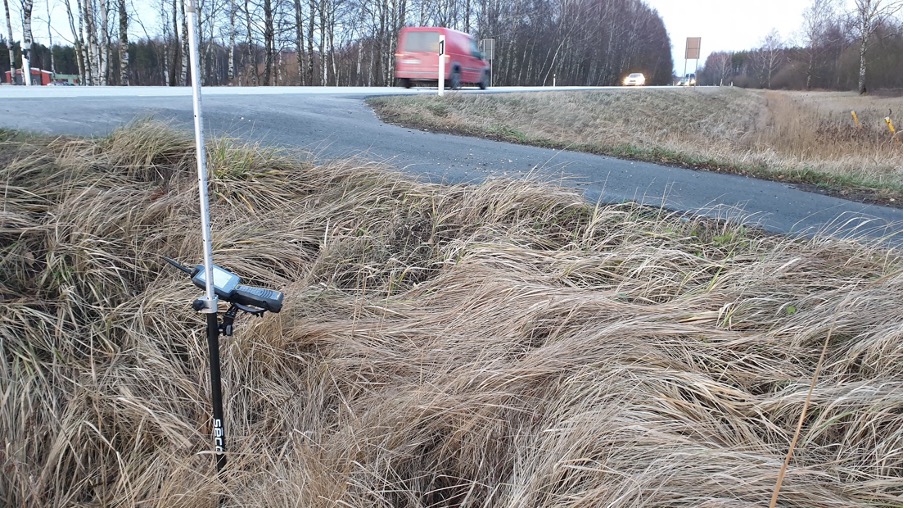
Figure 21. tall hay.
In this case, the advantage of LiDAR is that some of the laser beams reach the ground through the grass, and we can get data on the ground using different algorithms. Also, if we need to measure something high in the air, like 330kv overhead power lines, it is quite certain that if the flight is done correctly, some of the laser beams will hit the overhead power line and we will get accurate data on its location.
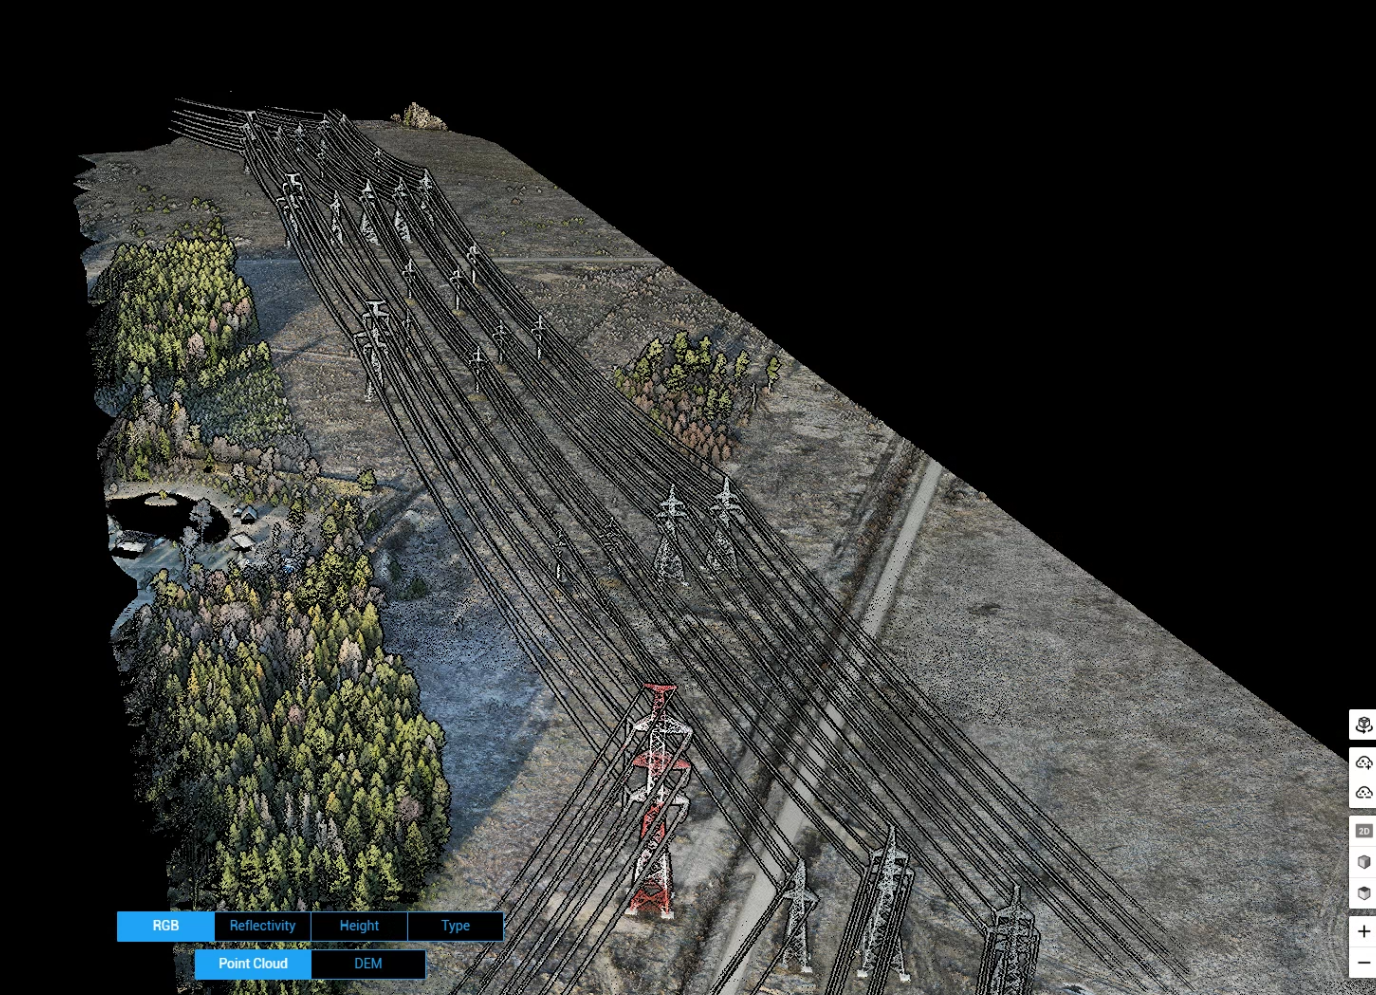
Figure 22. power lines
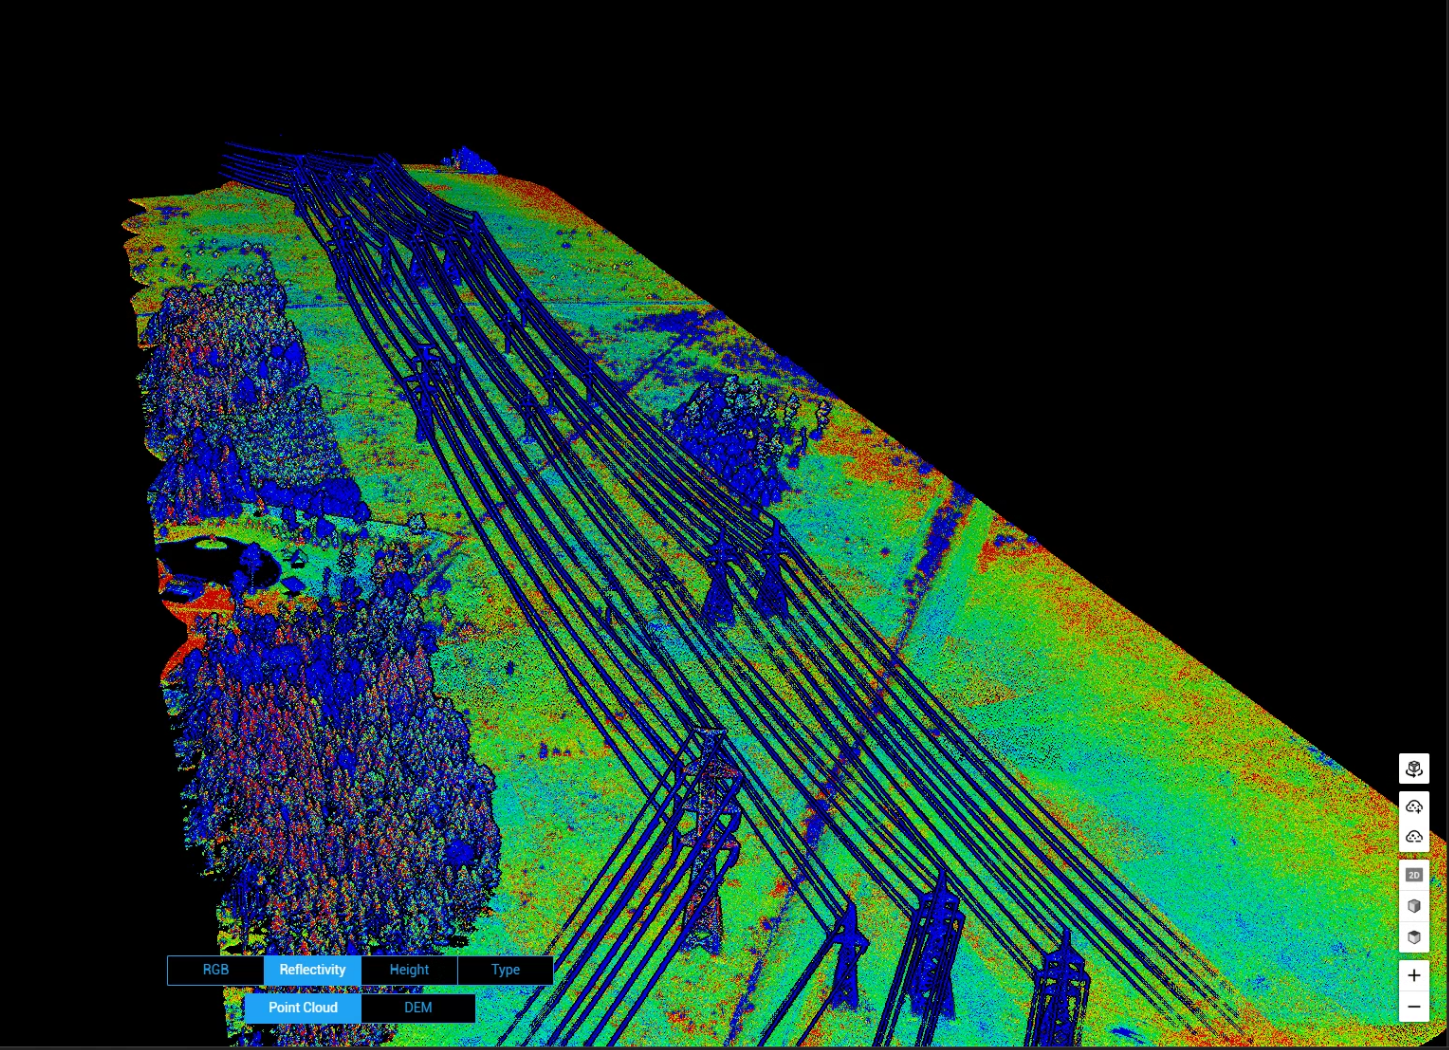
Figure 23. power lines
The first major drawback of LiDAR is its relatively high cost and, compared to photogrammetry, its lower accuracy – especially when LiDAR is packaged in a size that can be used by unmanned aircraft. Fortunately, one of the first reasonably priced LiDARs to provide the necessary accuracy, the DJI L1, came onto the market some time ago. To the benefit of those who cry “Yellowscan, Velodyne or others?”, I would reply with my subjective assessment that the DJI L1 was still significantly better value for money.
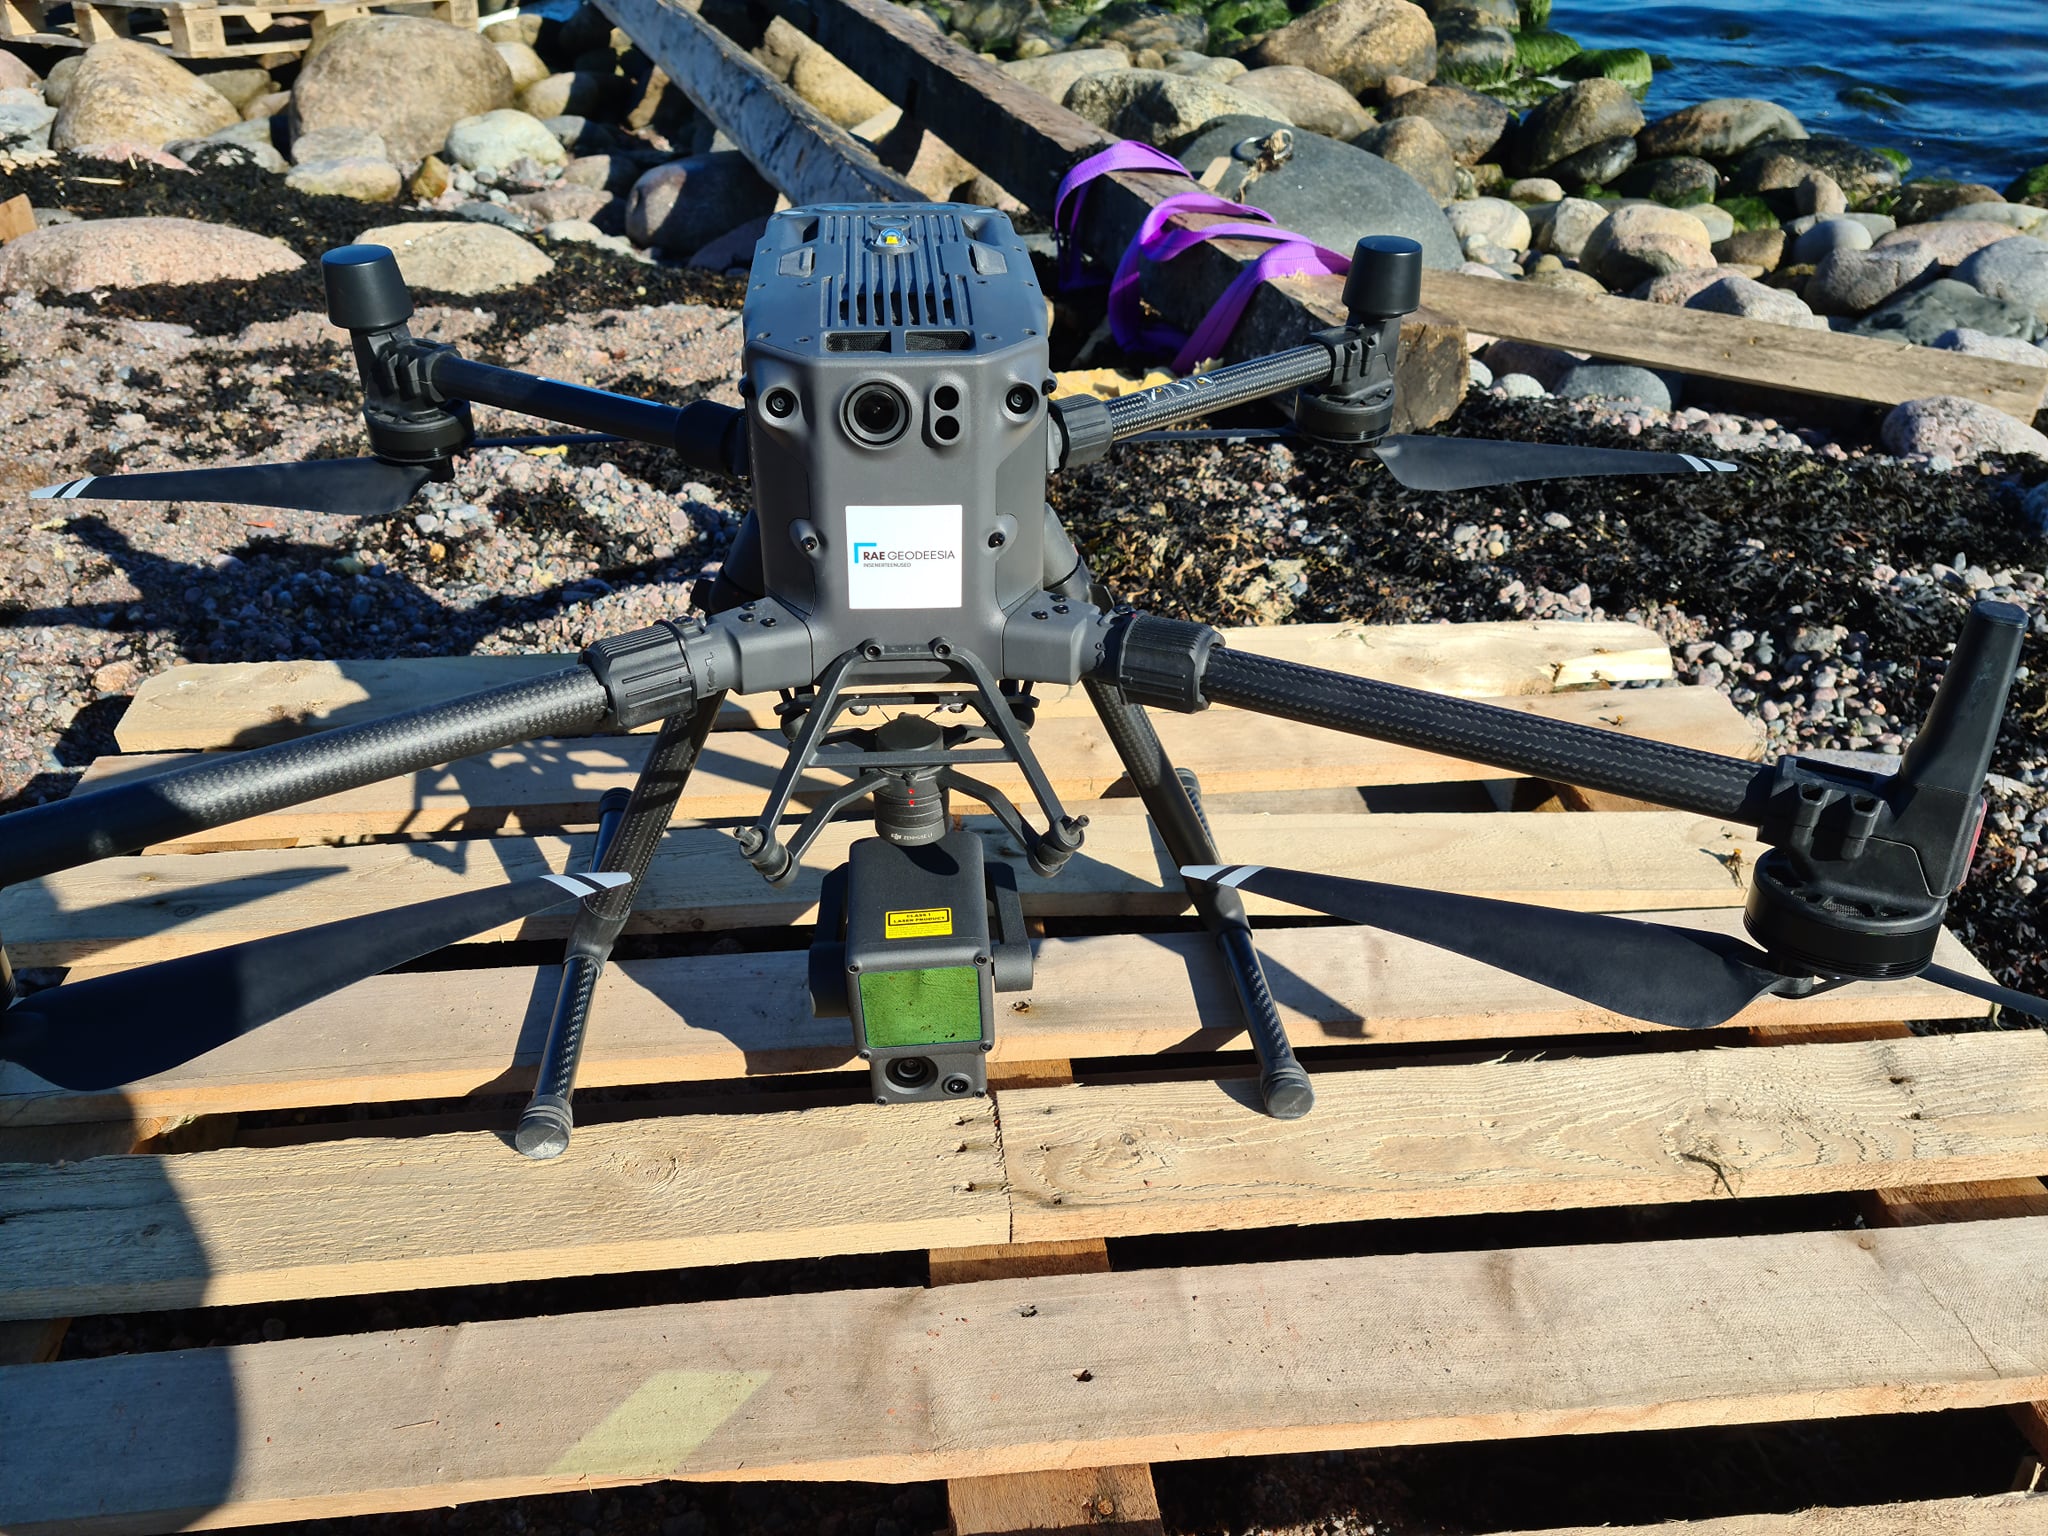
Figure 24. DJI M300 RTK + DJI L1
For example, with the DJI L1 we carried out a 90km high-voltage line survey from Tartu to Valga. Initially the L1 was planned to be used as a test, but when the results showed that we could trust the data, we surveyed the whole section. The survey had its own problems, which were not anticipated at first. For example, during the spring-winter period, LiDAR took an awfully long time to warm up. From time to time, some of the data were not recorded and the section had to be overflown. Calibration had to be done every 100 flight seconds, etc. Also, when flying a long narrow straight corridor with no checkpoints inserted, the end of the line could miss the position by, say, 15m when compared to the checkpoints. As is often the case in such cases, the problem may be in the seal behind the remote control, or sometimes it may be that not all the necessary measures were taken to carry out the job successfully. Now, if anyone asks what these methods are, you’ll have to come to one of my lectures to find out – after all, you can’t just give away all the secrets and tricks. In any case, it was a fierce tool, but not one that I would have rushed out to buy.
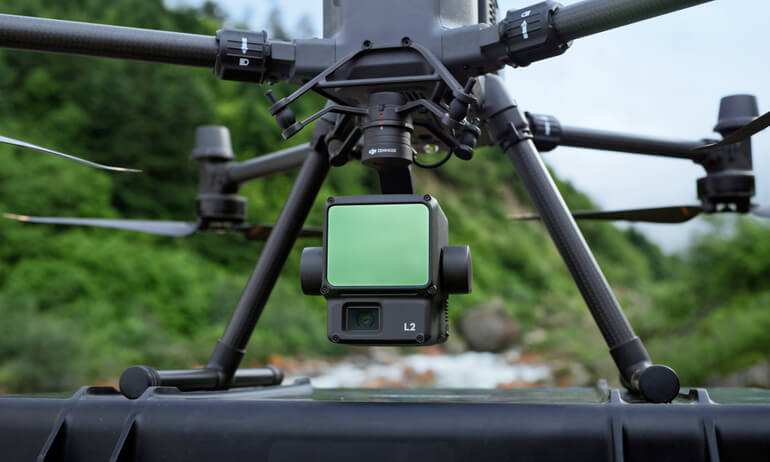
That’s why I was delighted to be at the Intergeo show in Berlin in October, when DJI introduced the new LiDAR, the DJI L2. The new LiDAR was a real excitement at the show, and a crowd gathered around the DJI area, blocking access to many of the other booths, and in a modern way, people were trying to transfer everything to somewhere while filming with their phones outstretched. There was someone next to me who was doing the same kind of live blogging for every sentence of the presentation that we see when Jüri Ratas changes parties. I didn’t think surveying equipment was that exciting. All the more I was delighted when Eduard from Droon.ee called to tell me that the first L2 was due to arrive in Estonia soon and if I would like to test it. You might as well ask a child if you don’t want some candy. The answer is still the same. Of course I do. And so it was that after arriving in Estonia, the L2 was in my hands for a few weeks, where I tested and compared it with its predecessor, the DJI L1, as well as with my usual DJI P1 photogrammetry.
What’s new in L2 LiDAR
The DJI L2 does not need the IMU warm-up time that the L1 had. At times it even took 10-12 minutes with the L1. Bigger sensor, better accuracy and distance on the laser, more recordable reflections, etc.
Droon.ee was happy to share a comparison of the technical data, which I also refer to here:
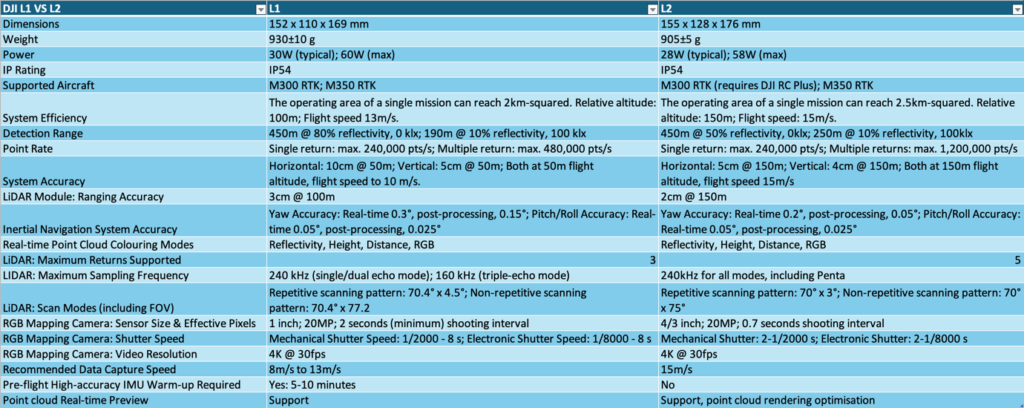
Figure 25. DJI L2 vs L1
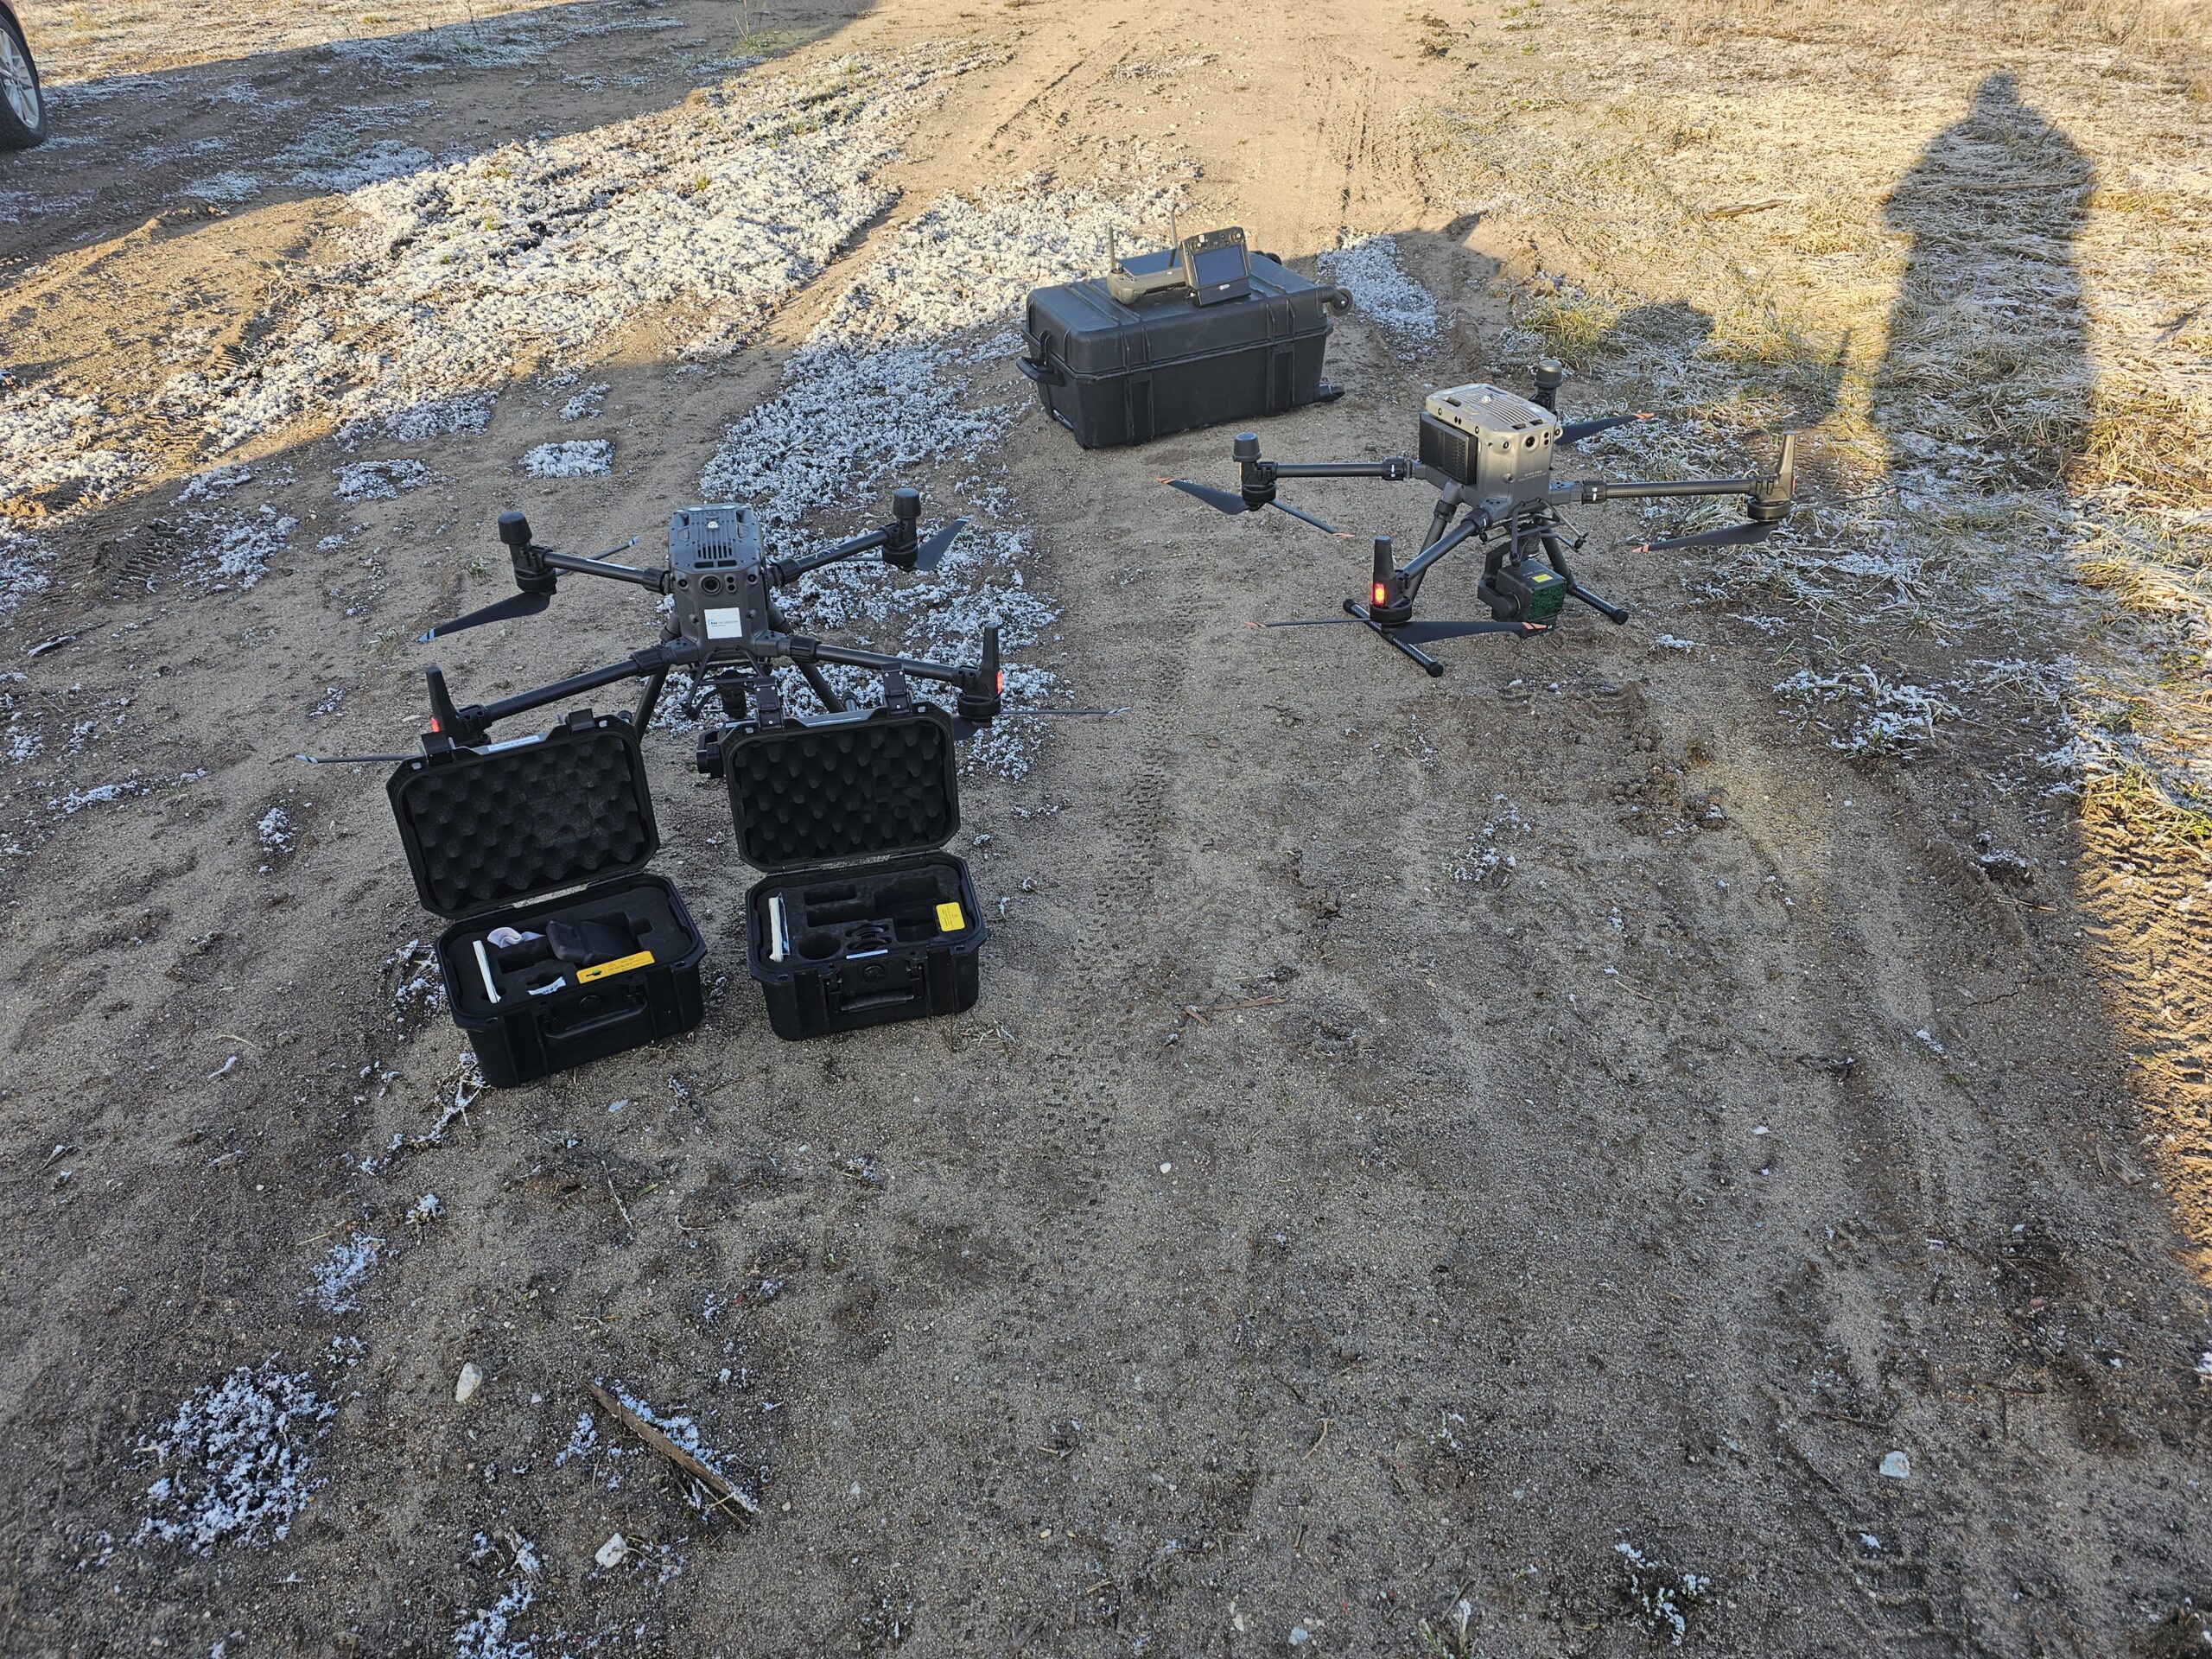
Figure 26. DJI M300 + P1 and DJI M350 + L2
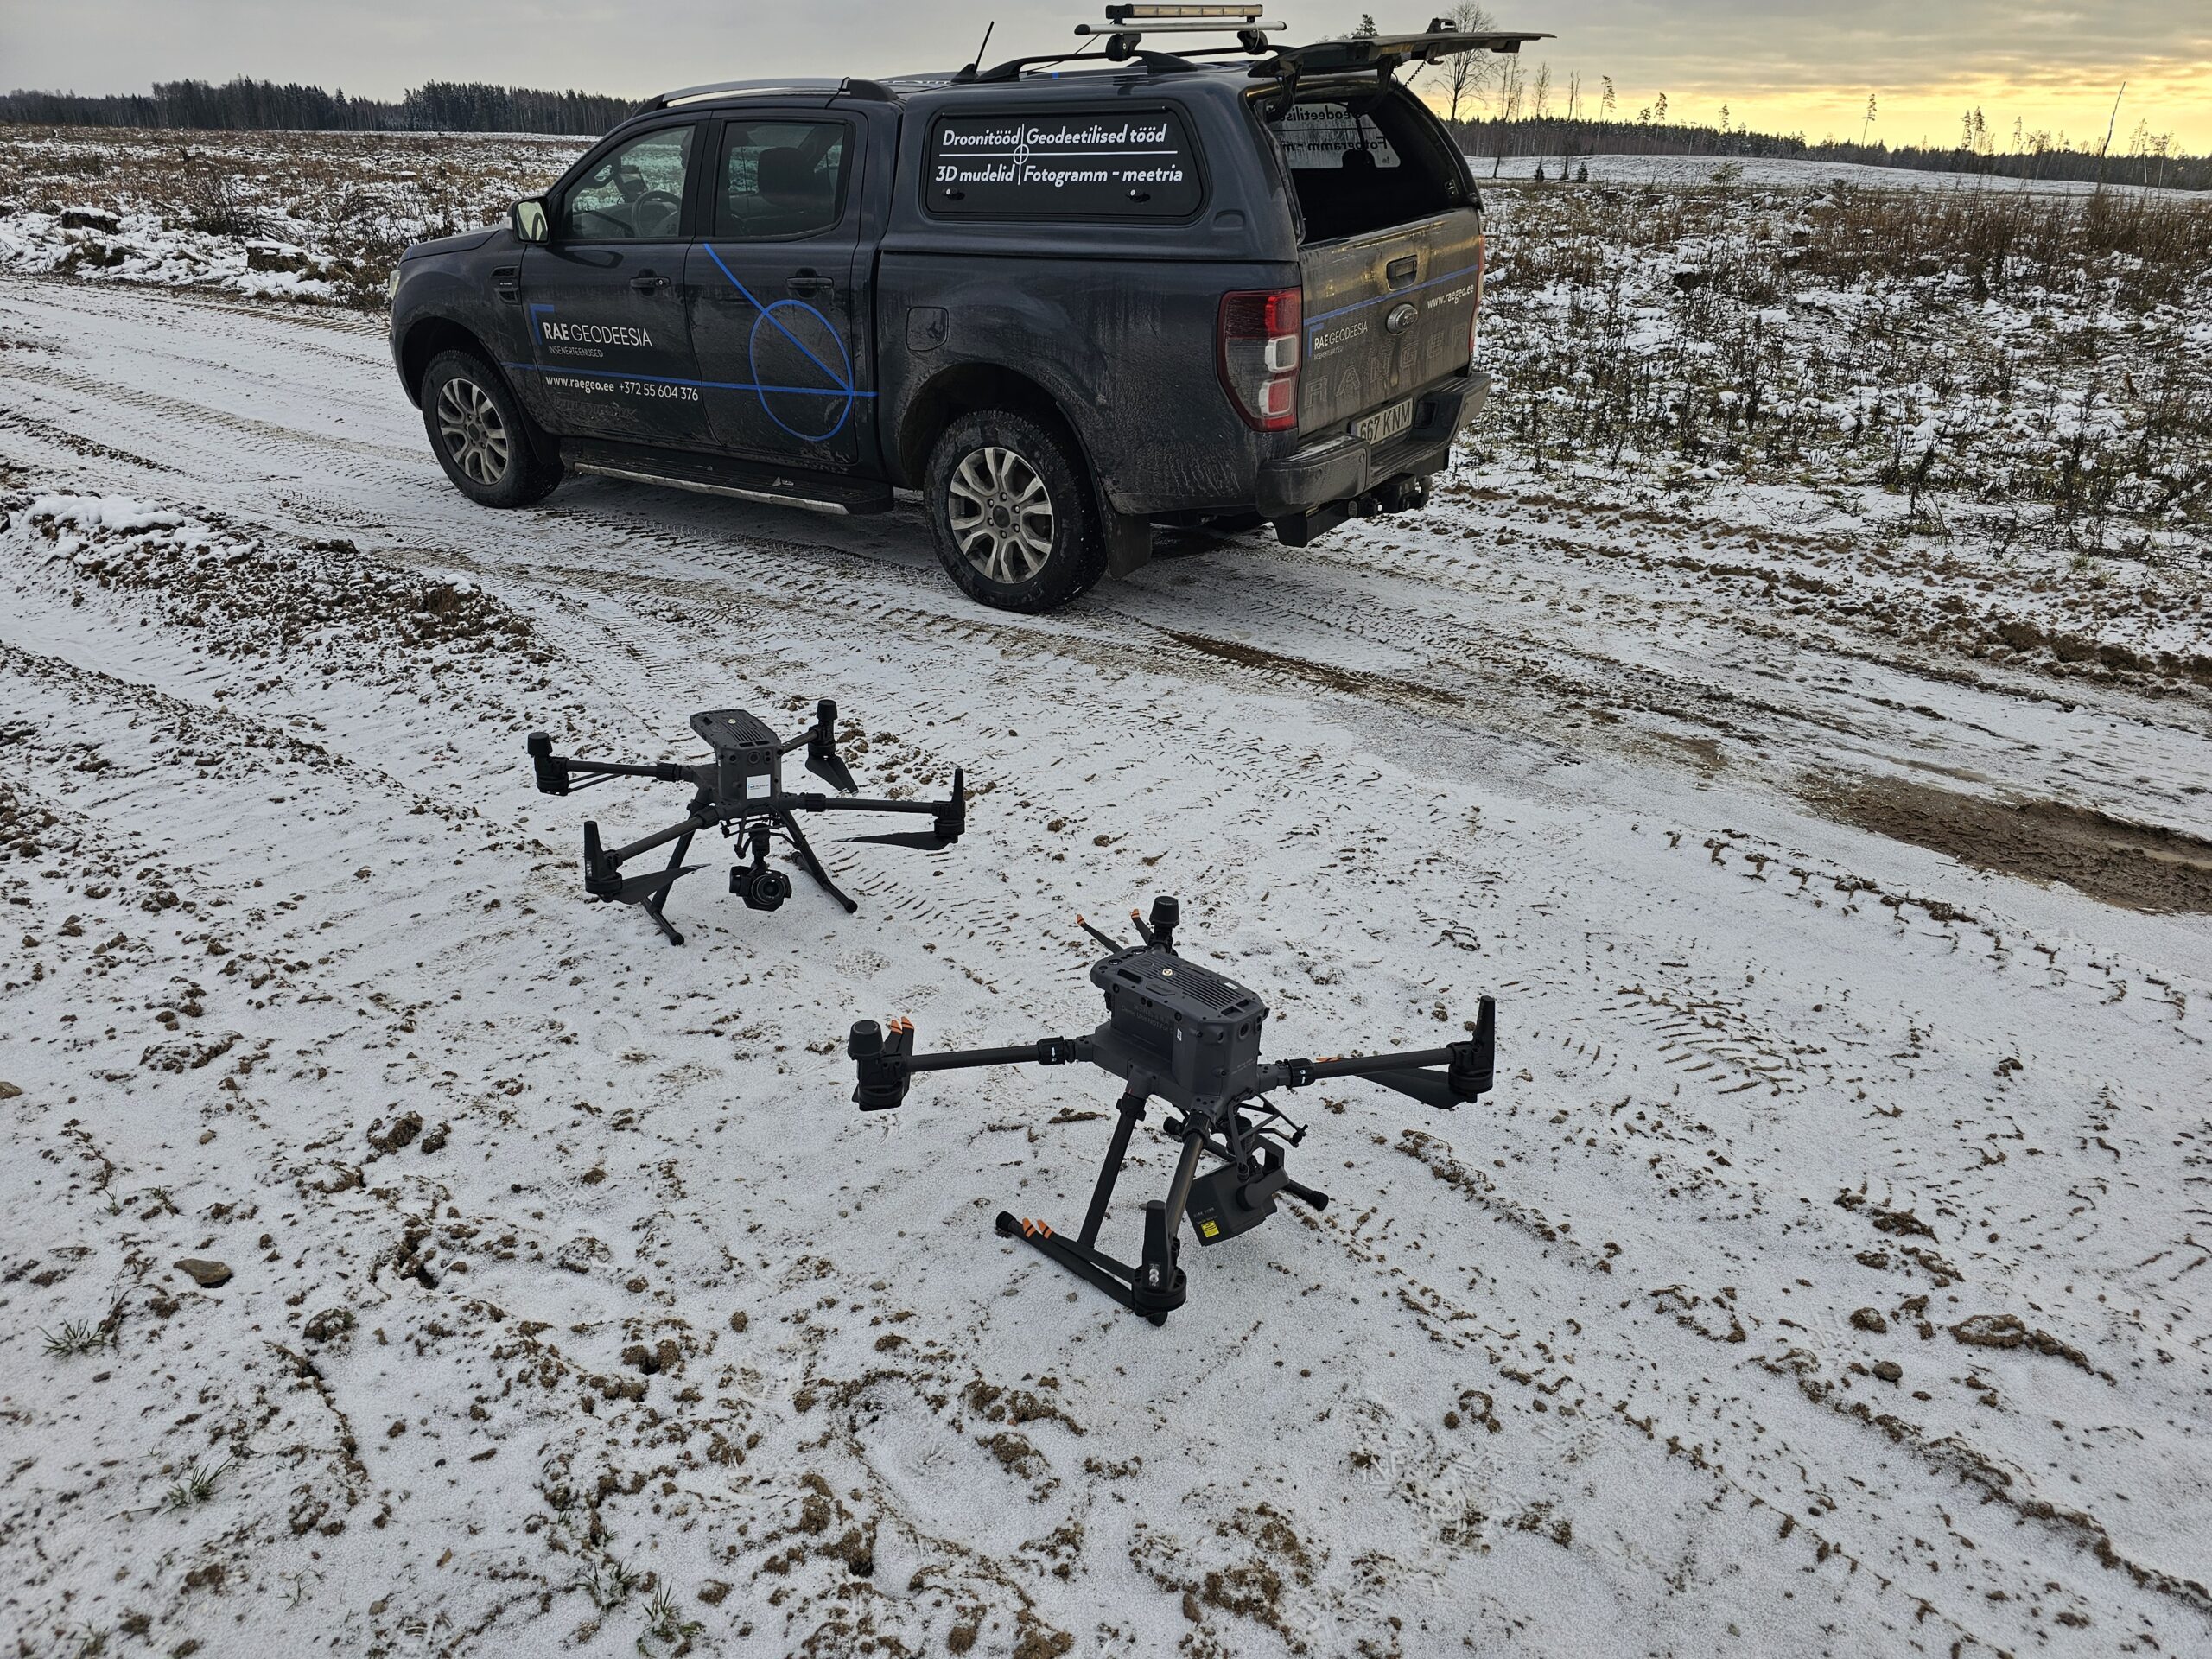
Figure 27. DJI M300 + P1 and DJI M350 + L2
As part of my own experiments, I tried to involve L2s as much as possible in “real” activities. One of the results of this work is a thesis to be defended in the spring at the University of Life Sciences, analysing the accuracy of power line surveying, comparing a tachymetric survey, a photogrammetric survey, and a L2 lidar survey. If you are interested, keep an eye out.
Another one of the more interesting jobs for me was one where I had to survey a little less than 10km2 or 1000 hectares of land in a relatively limited time. During this survey, the advantages of LiDAR over photogrammetry became particularly clear. At the time the LiDAR drone was finishing its work, the camera drone was only approaching the half-way point. However, given the task at hand, the LiDARr provided the accuracy and data that were essential for the task. Also, the example of this work nicely illustrates that one of the advantages of using LiDAR is the shorter time needed for post-processing (the part where the computer is stuck and cannot do anything).
In the example of this work, it took 2h 39min to fly the drone with the L2 and 2h 35min to process the point cloud. For the P1 camera drone, the flight time was about 7h, and the processing time was just under 100h.
In case anyone was wondering why I was pointing out the IMU warm-up, in the example of this work with the older L1 LiDAR, the IMU warm-up time would have been an additional 2 hours. So almost as long as the rest of the flight itself.
Of course, the result of the work was also different (the detail of the photogrammetric orthophoto was such that the 2cm elements were easily distinguishable), but for this task, in fact, the work done with LiDAR would have been sufficient.
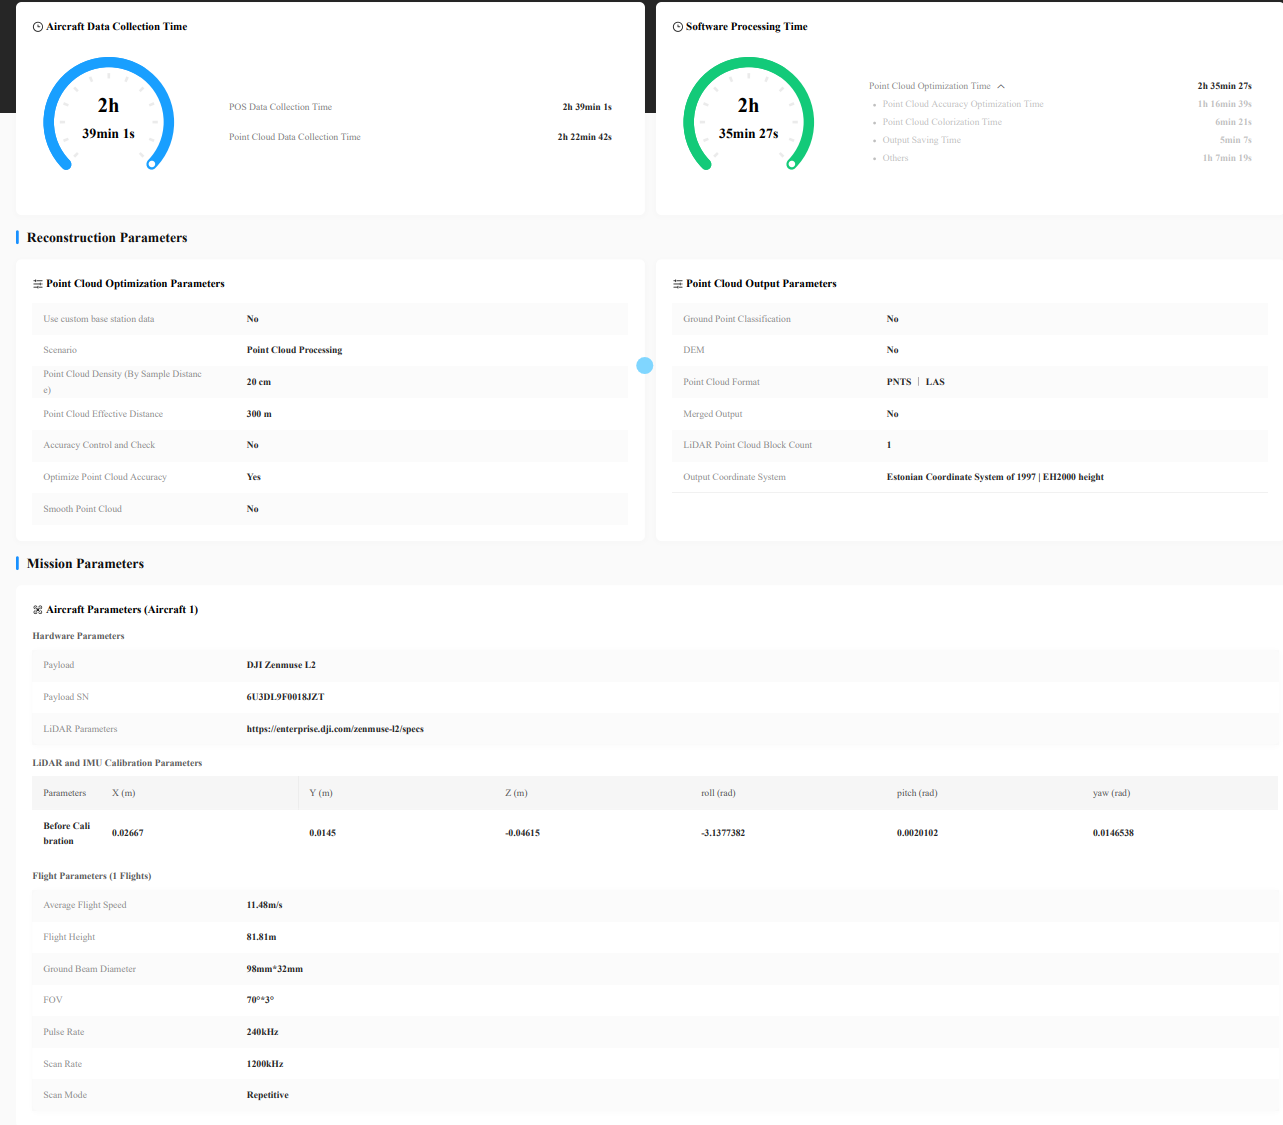
Figure 28. Extracts from the processing report
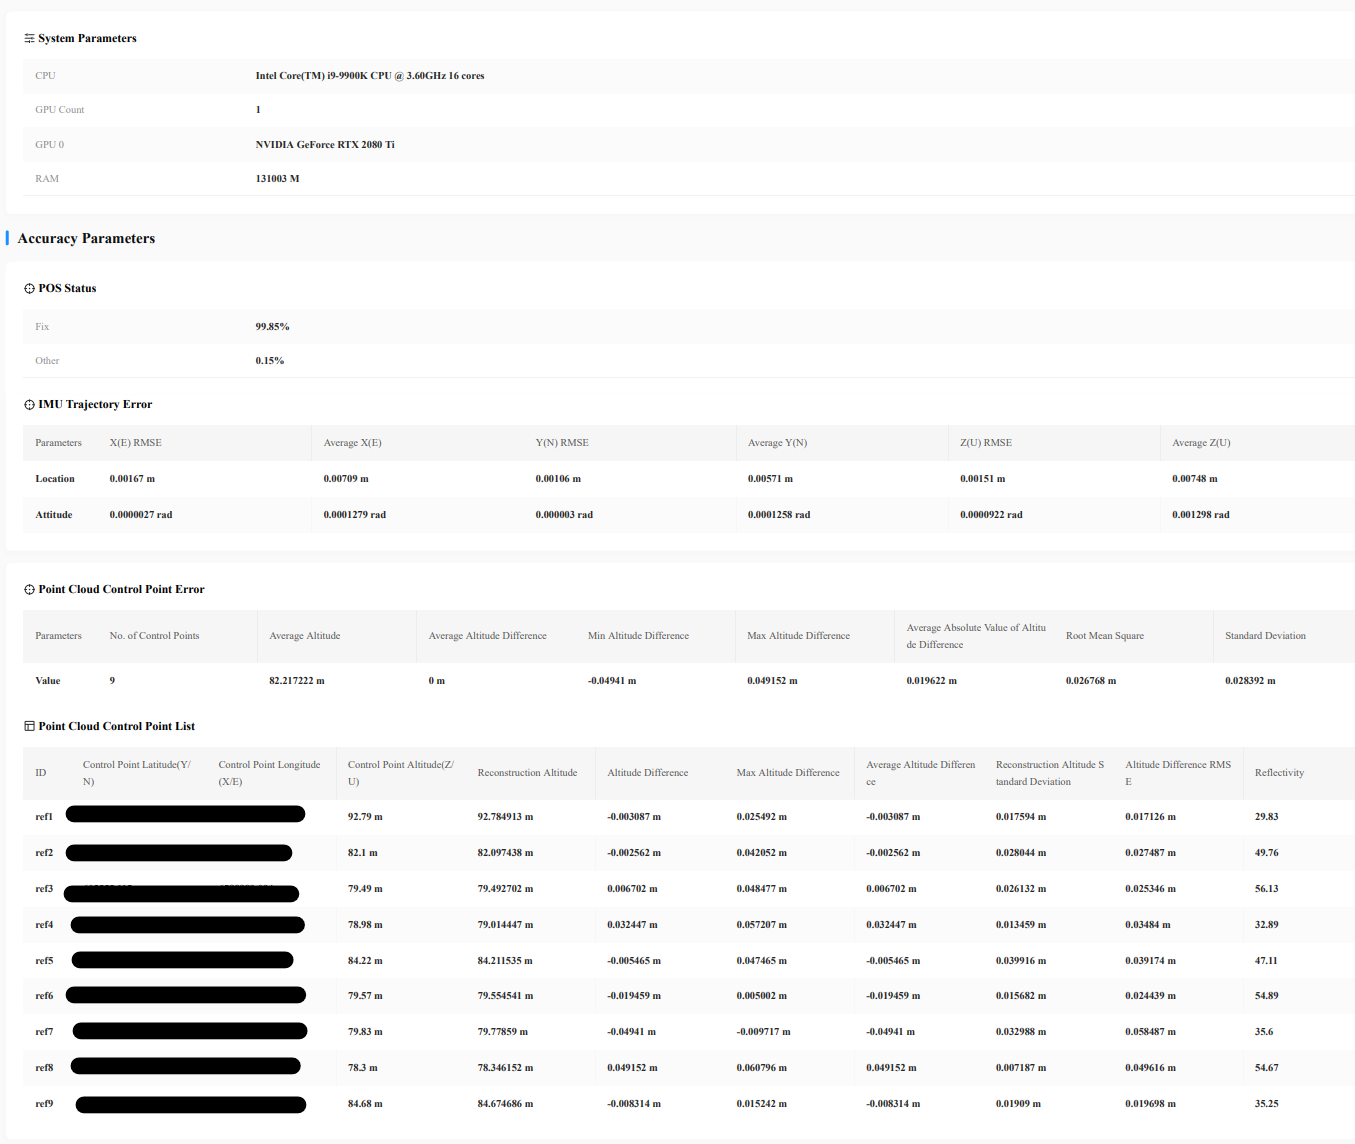
Figure 29: Extracts from the processing report
As can be seen from the above report, the actual accuracy of the point cloud when using control points is even significantly better than the manufacturer claims. Also, the quality of the point cloud was much better in pure visual observations. Objects that would otherwise be obscured by tree branches, as well as those that were behind something, in the air, or otherwise difficult to see, were better captured in the cloud. For example, I found low-voltage pole pulls in the point cloud that the geodetic surveyor had missed.
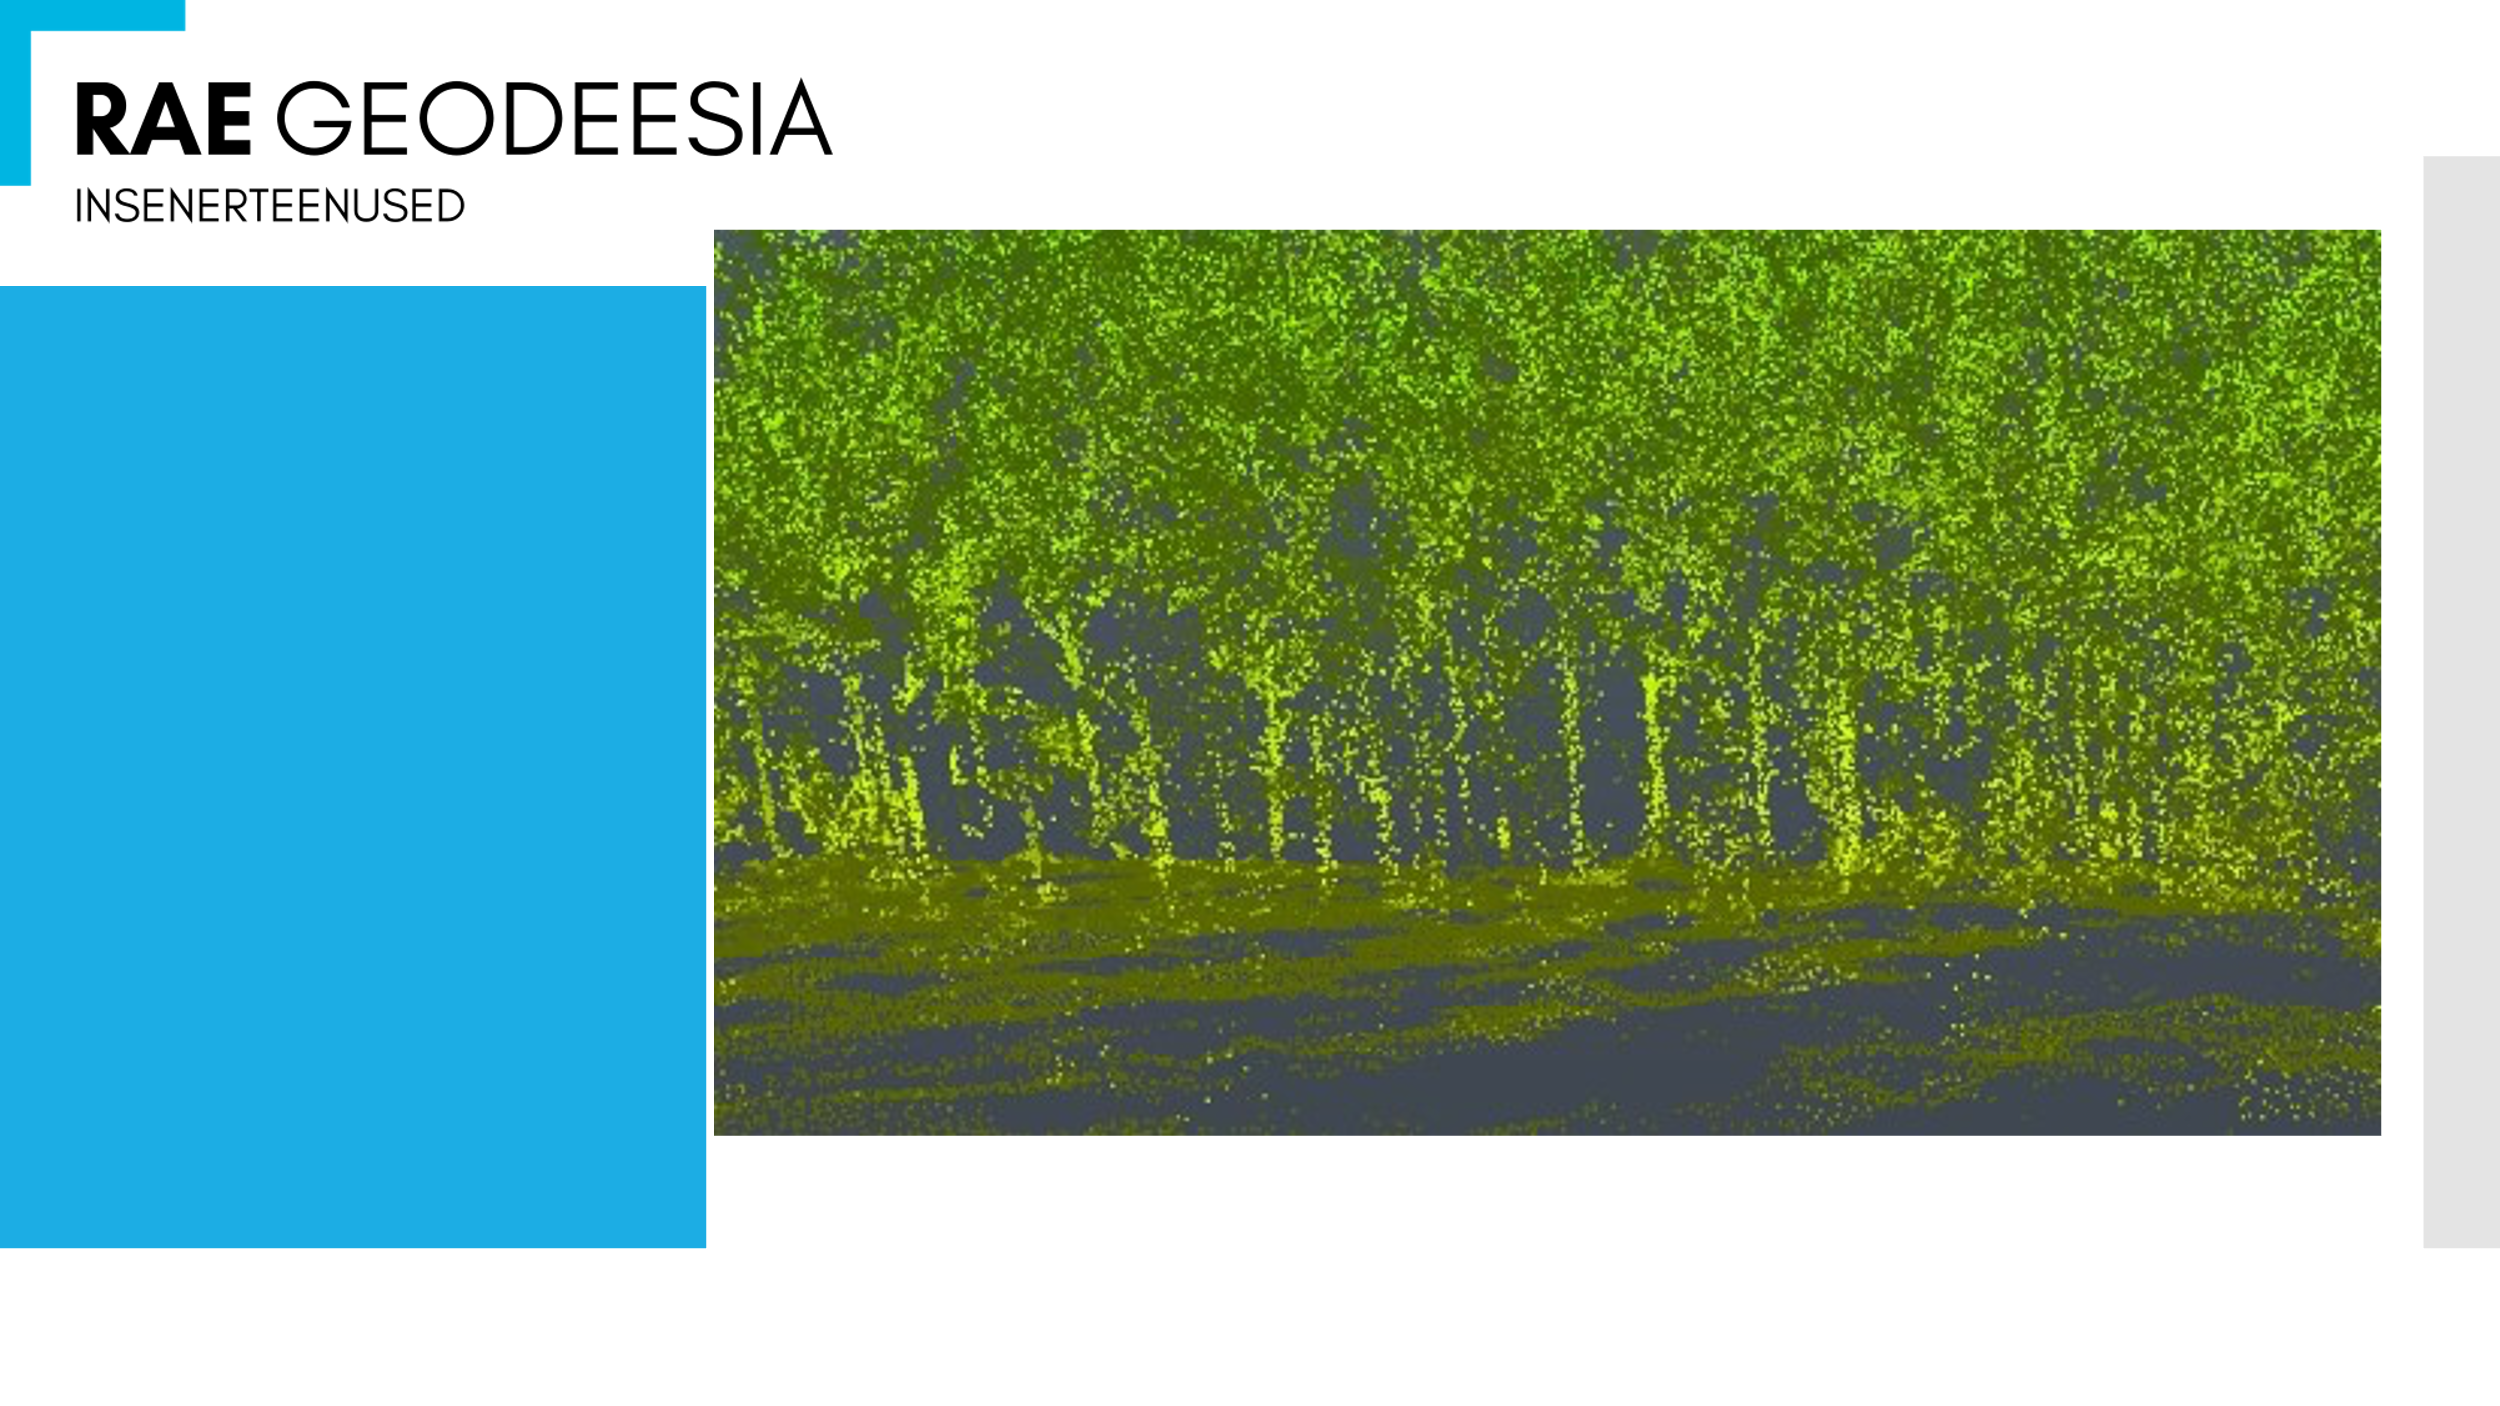
Figure 30. Point cloud view from the forest
The initial impression from this brief experiment is extremely positive, and I will try to find the time in the winter to do some more serious analysis. It is safe to say that the speed of operation, data quality and ease of use have taken a significant leap forward from the past, and it is a very good product with good value for money.
If you are interested in the topic, I recommend you download the in-depth analysis “DJI ZENMUSE L2 ACCURACY ANALYSIS AND USE CASE EXPLORATION” jointly prepared by DJI and BAAM.Tech, which goes into much more detail than would be appropriate in a single blog post.
If you have any questions about the DJI L2 lidar and how to use it, please feel free to contact me or the team at drone.ee.